
This is a technical tutorial for sailors who need satellite image charts for remote areas, such as the atolls of French Polynesia, where we are currently cruising. When I looked for tutorials on creating satellite charts for OpenCPN on a Mac, I could only find guides for Windows. There were one or two old Mac tutorials out there, but they were outdated enough that I had to piece together the instructions for the current version of the application I was using to create the chart images. This is that missing Mac guide. And since the tool I’m using works on Windows and Linux too, Windows users will probably find this helpful as well, since most Windows tutorials out there are for software that is just as old and outdated.
Why Use Satellite Images
I’m cruising the Tuamotus in French Polynesia right now, and charts here are either nonexistent or so inadequate they’re almost useless. A decent satellite image shows me things in the water that simply aren’t on the chart. That’s the whole justification for building your own charts instead of relying on someone else’s.
They work beautifully in clear water, the kind you find here in the atolls, where you can see through 20 meters of water. In dark water, like the Chesapeake Bay, a satellite image isn’t helpful. They’re also excellent for finding stationary objects: coral heads, rocks, things that have been sitting in the same spot for decades or centuries. Non-stationary objects like sandbars are trickier. You can see them on a satellite image, but they move over time with currents, so I wouldn’t trust a satellite image to navigate through sandbars. That’s still eyeball navigation territory.
Satellite images in Google Maps might seem like an obvious choice, but it’s not designed for what we’re doing. It has no concept of navigation in open water where there are no roads or paths. You can’t draw a route on it and then follow that route later underway. You need a proper navigation program, like OpenCPN, to do that.
If you’re familiar with using satellite images in OpenCPN for navigation, you might already know you can download ready-made satellite images from sources like The Chart Locker or SoggyPaws, and that’s a valid shortcut. But many of those images were generated years ago. They rely on the creator’s choice of satellite source, which may not be the best available today. They also cover entire regions, so you’re downloading massive amounts of data for places you might never visit.
Creating your own satellite images gives you control over all of that. You can compare multiple satellite sources and pick whichever looks clearest for that specific area on that specific day. You get the latest available imagery, and you create tiles only for the places you actually plan to cruise, which means you’re using a fraction of the disk space you’d need if you downloaded pre-made regional sets.
Why Use OpenCPN and MBTiles
OpenCPN is a full-featured navigation program (you can build routes, track your movement, pull in AIS, all of it), and it’s free. It’s also the program that makes this workflow possible because of how it handles satellite imagery.
When you create your own satellite charts using the process in this article, they’re saved in a format called MBTiles. An MBTiles file is a single file that stores all your captured satellite imagery at multiple zoom levels. Instead of ending up with thousands of individual image tiles scattered across folders, everything for a given area lives in one portable file. You can drop that file straight into OpenCPN, copy it to another device, or back it up, all as one unit. That’s exactly what we want on a boat.
The tool that makes this possible is called QGIS. It’s a free geographic mapping program, and while it’s built for much bigger jobs than ours, we’re only going to use one small piece of it: pulling satellite imagery from a source like ArcGIS or Google and packaging it into a file OpenCPN can read.
Setting Up QGIS
QGIS does the heavy lifting by converting satellite images from different sources into MBtile files. QGIS runs on Mac, Windows, and Linux, and you can download it from QGIS.org (it’s a large file, so downloads can be slow). At the time of this writing, I’m running the Long Term Release, version 3.44.12, so things may change slightly with future versions. Once downloaded, install it in your Applications folder like any other Mac app. Launch the application, then continue reading.
Set the Project CRS
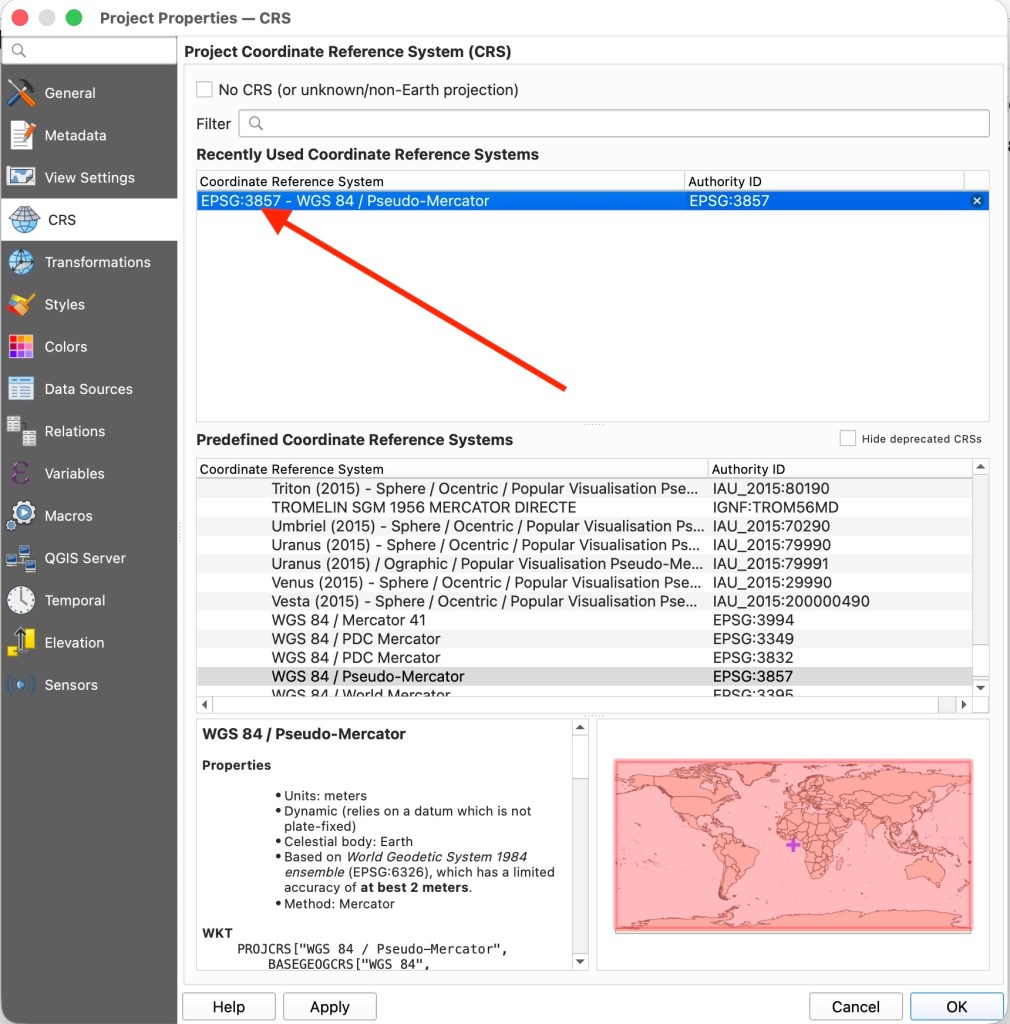
Before doing anything else, you need to set your project’s Coordinate Reference System (CRS) to EPSG:3857 (WGS 84 / Pseudo-Mercator). This is required for MBTiles to work correctly.
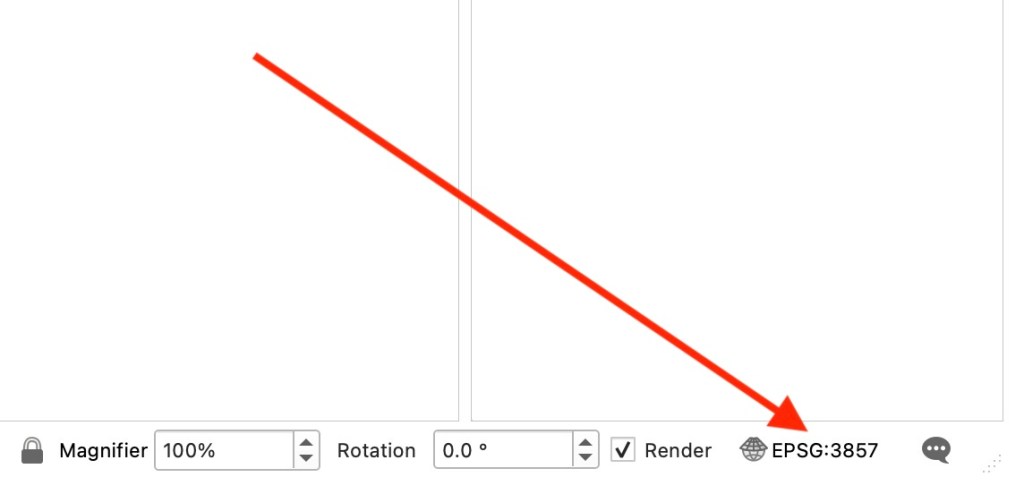
Look at the bottom-right corner of the QGIS window for the current EPSG code and click on it. That opens the Project Properties CRS tab. Type 3857 into the Filter box, select EPSG:3857 – WGS 84 / Pseudo-Mercator, and click OK. While you’re there, remove any EPSG:4326 entry if one shows up.
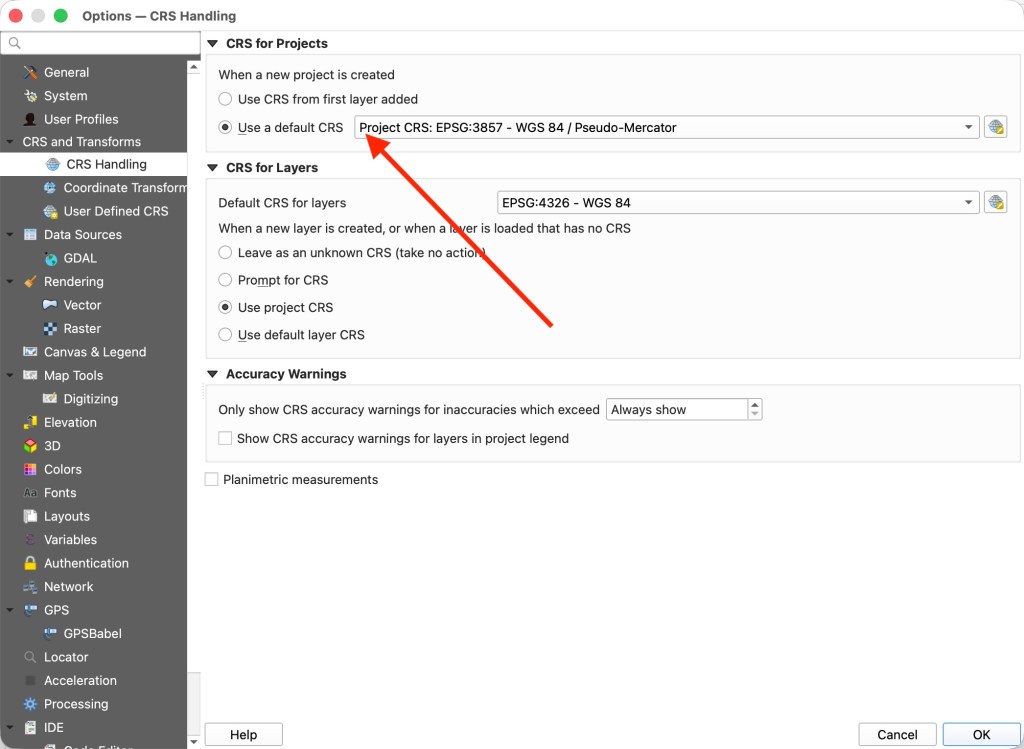
That setting only applies to the current project, though, and I got tired of resetting it every time I opened QGIS. To make it stick, open Preferences from the QGIS menu, go to the CRS Handling tab, and under CRS for Projects, set “When a new project is created” to Use a default CRS, then set it to EPSG:3857 – WGS 84 / Pseudo-Mercator. Click OK.
Loading Satellite Sources
I’ve preconfigured the connections to several satellite image providers for you, so you don’t have to manually configure each one. The configuration file includes settings for ArcGIS World Imagery, Bing Satellite, and Google Satellite, the three most popular.
Download and unzip a copy of my XYZ Tiles Connections.xml file to your computer. (Note: On a Mac, it will unzip this file automatically, if you are on a Windows machine, you will need to unzip it first.)
Now right-click XYZ Titles in the Browser panel (on the left side of the screen) and load my connections file, selecting all three sources: ArcGIS World Imagery, Bing Satellite, and Google Satellite.
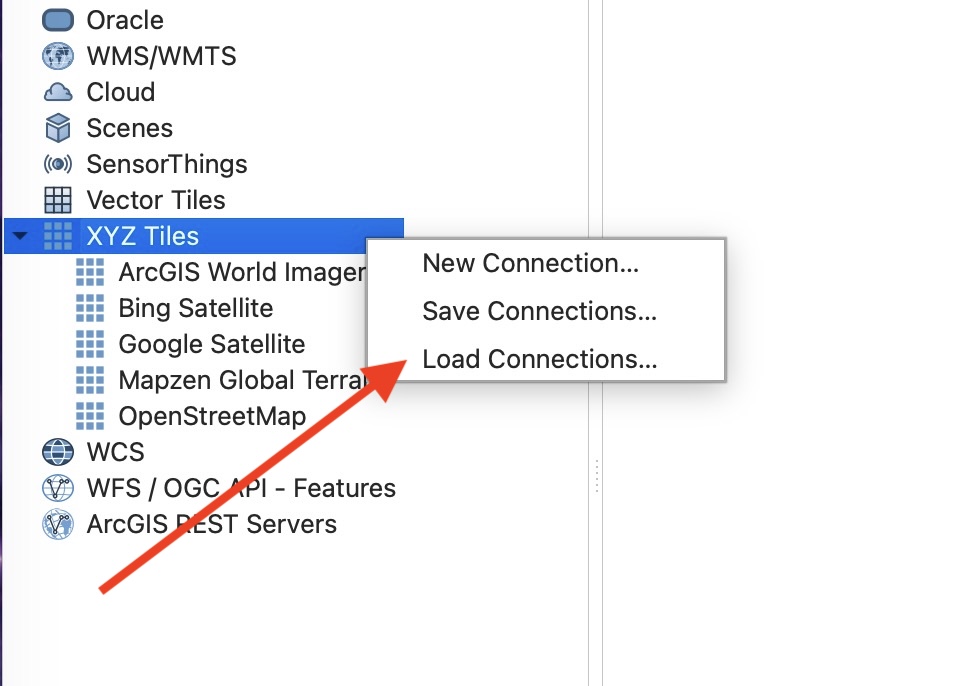
Once imported, you’ll see all three listed under XYZ Tiles, along with Mapzen Global Terrain and OpenStreetMap, which come installed by default (and you can ignore).
XYZ Tiles gets its name from how each map image is addressed: by column (X), row (Y), and zoom level (Z). It’s the connection type QGIS uses for ArcGIS, Bing, Google, and other satellite image providers.
Mapbox and HERE are also excellent sources for satellite images, but they require a free account and an API key. If you’re comfortable with that, you can add them as XYZ connections using these URL templates with your own key dropped in. Do not change the URLs other than adding in the API keys. Otherwise, you can read on and come back to this later.
https://api.mapbox.com/v4/mapbox.satellite/{z}/{x}/{y}.jpg?access_token=<YOUR ACCESS TOKEN HERE>https://maps.hereapi.com/v3/base/mc/{z}/{x}/{y}/jpeg?style=satellite.day&apiKey=<YOUR API KEY HERE>
Comparing Sources
Open one of the satellite layers (I usually start with ArcGIS) and zoom into the area you’re interested in capturing. You can use the zoom buttons on the toolbar, or on a Mac, use the two-finger up-and-down gesture. The pinch gesture doesn’t work like it does on a phone. Then add a second source, like Bing, on top of it.
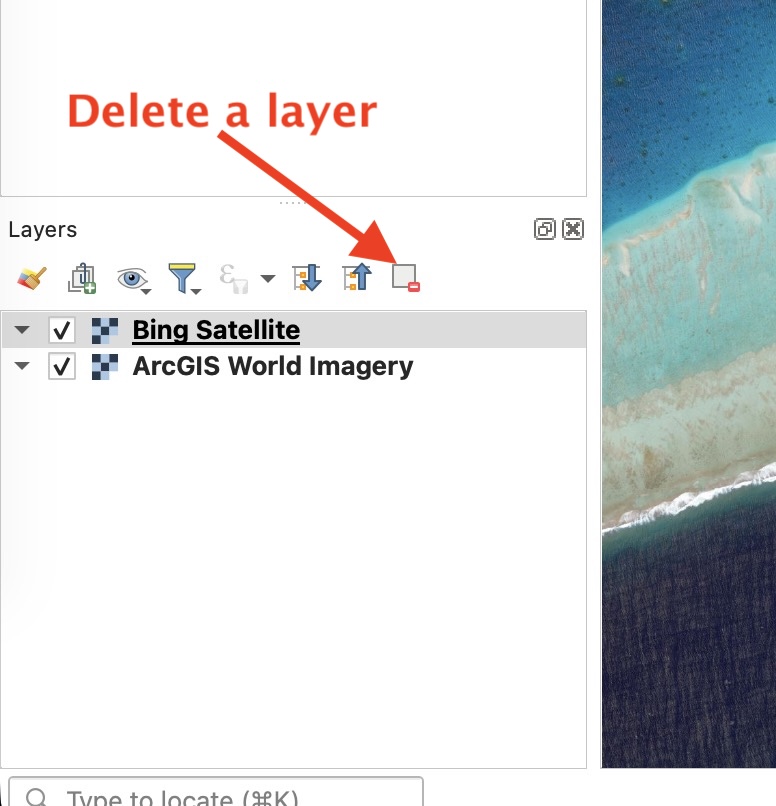
The topmost selected layer in your Layers panel is the one you’ll see on the canvas. You can toggle between sources by dragging them up or down in the layer order or by unchecking the layers you don’t want to see. You can remove any you don’t want using the delete icon.
It’s worth reviewing multiple sources rather than settling on one. Different providers capture imagery at different times, so you’ll see varying tide levels, sun angles, and cloud cover. One source might have a cloud right over the pass you need to see, while another might not. It’s rare that a single image is best for the entire route. I usually create MBTiles from multiple images and toggle between them as I’m creating my route.
Generating the MBTile
Whichever image is visible on the canvas when you generate the tile set is the one that gets exported, so make sure the layer you want on top is the one showing.
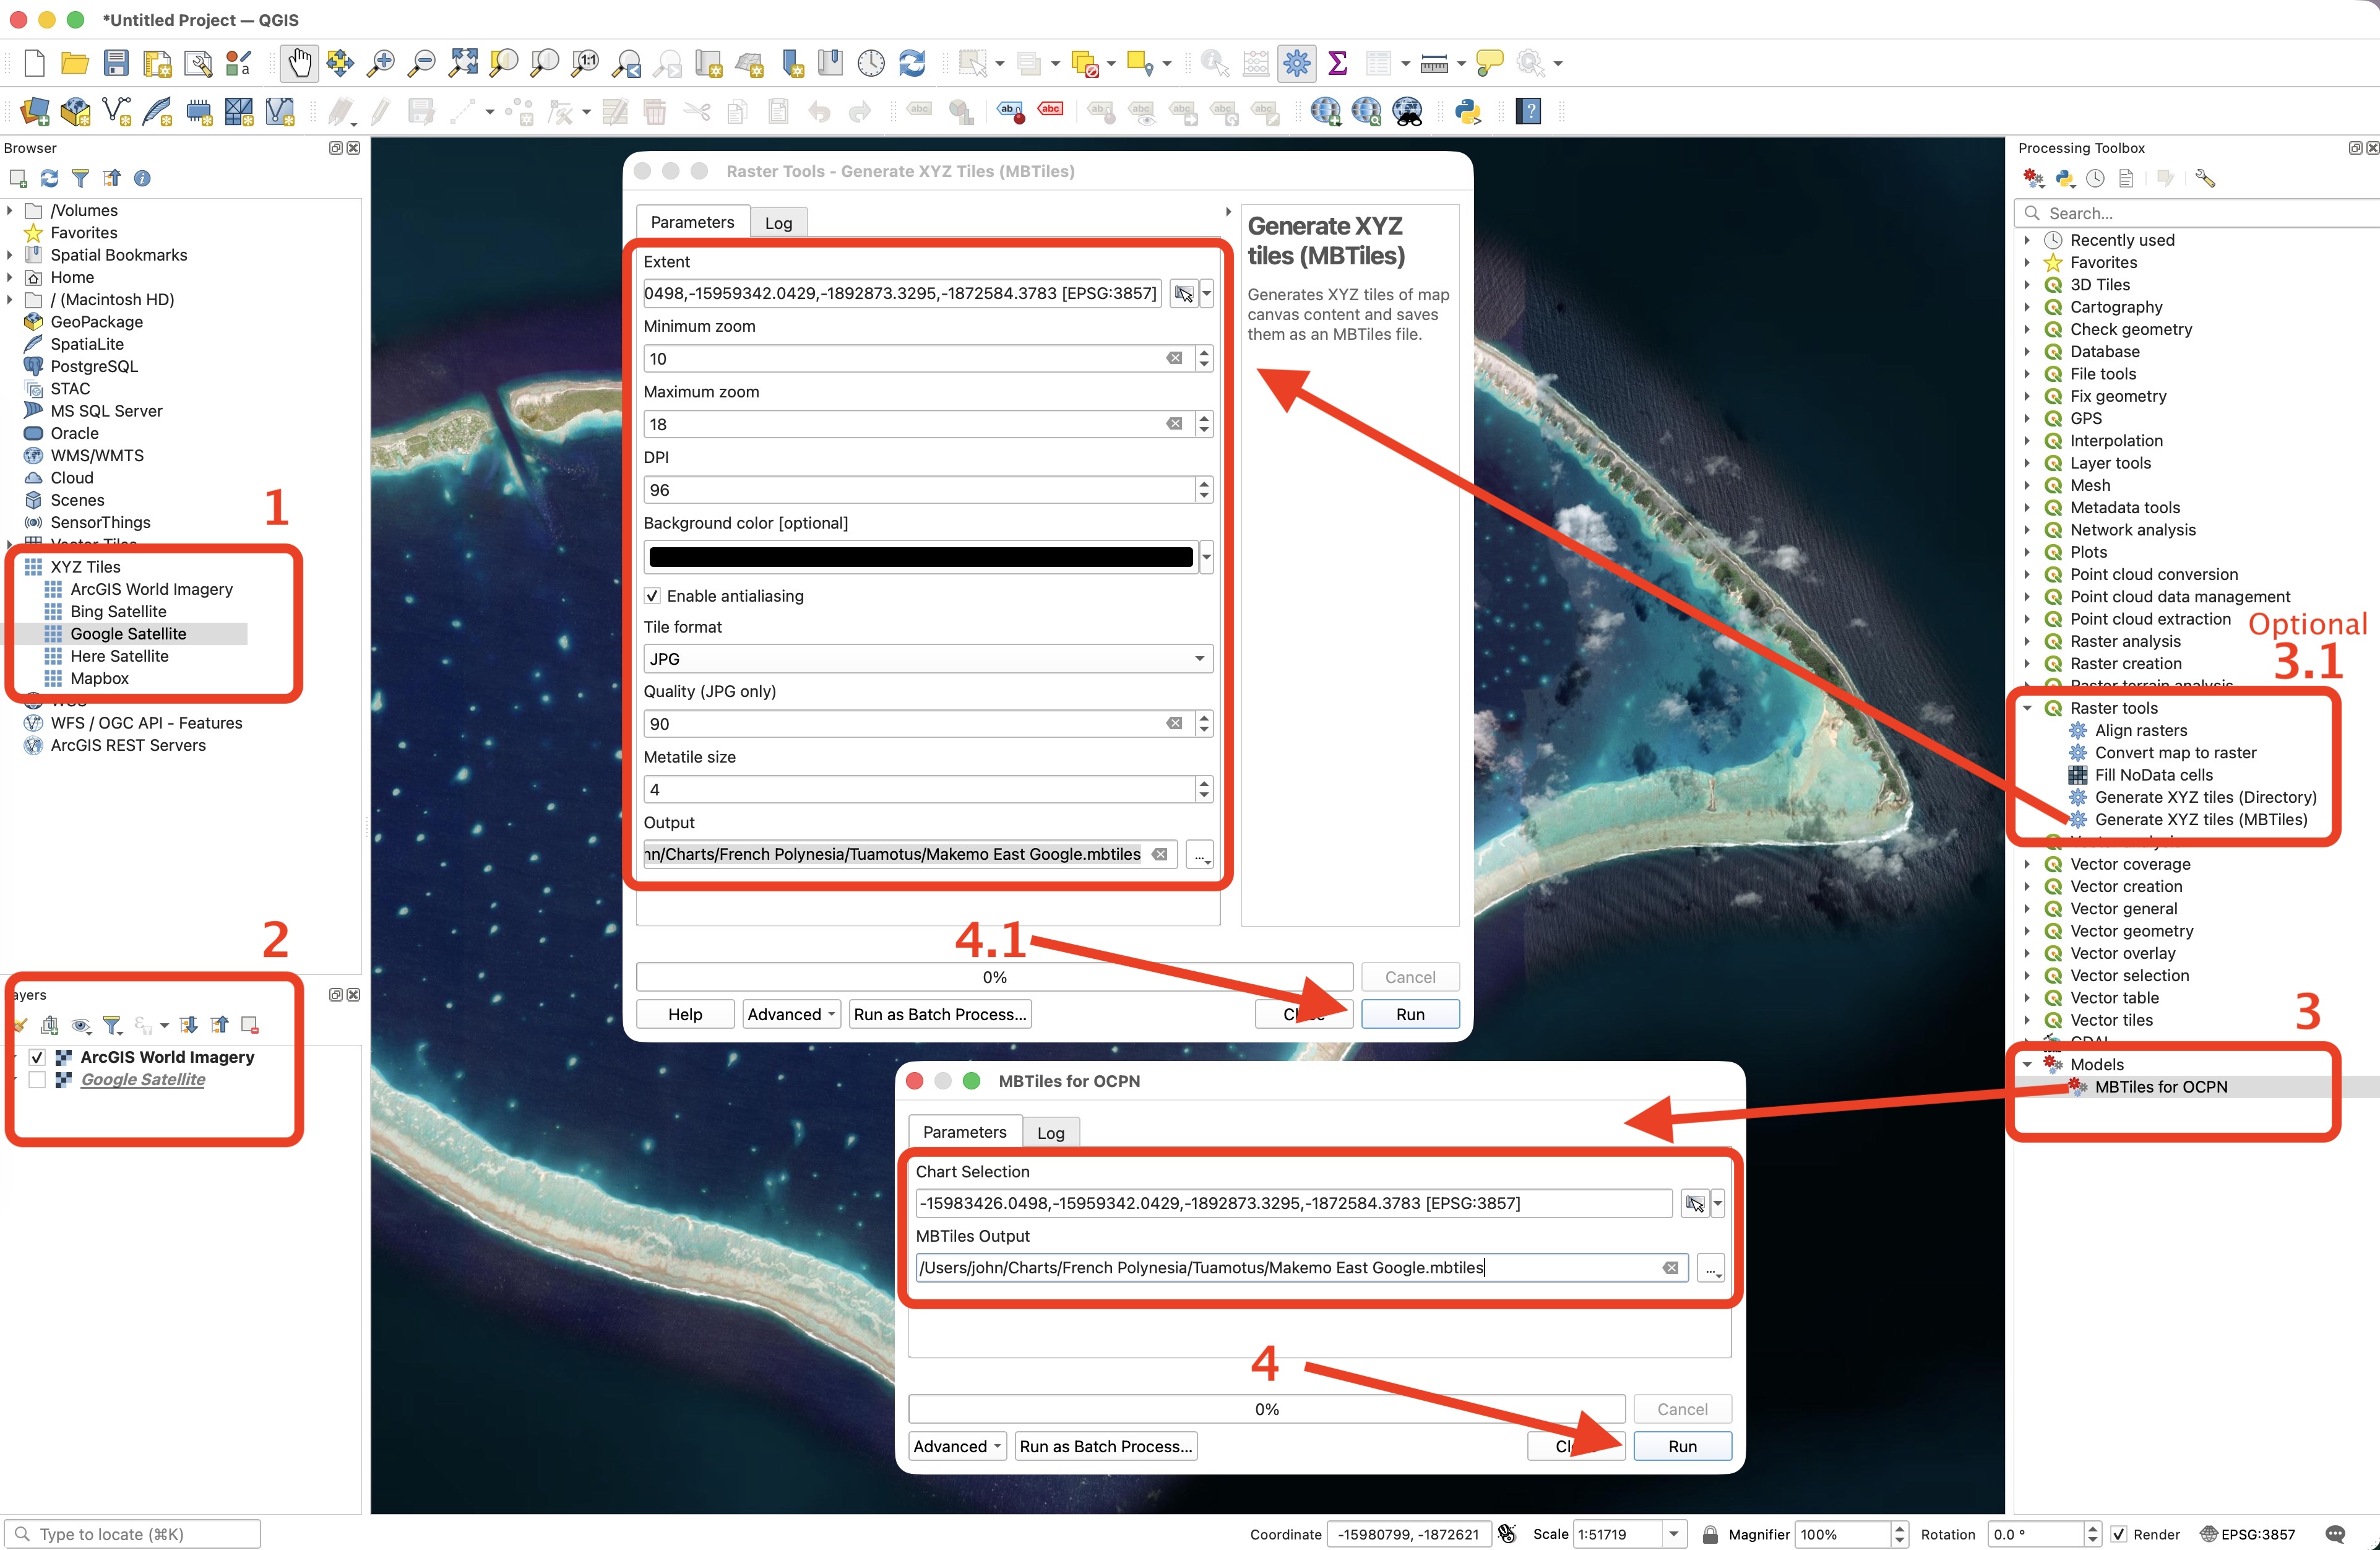
Open the Processing Toolbox by clicking Processing >> Toolbox in the top menu. Under Raster tools, double-click Generate XYZ tiles (MBTiles). Note: Don’t use the Vector tools version, which is a common mix-up.
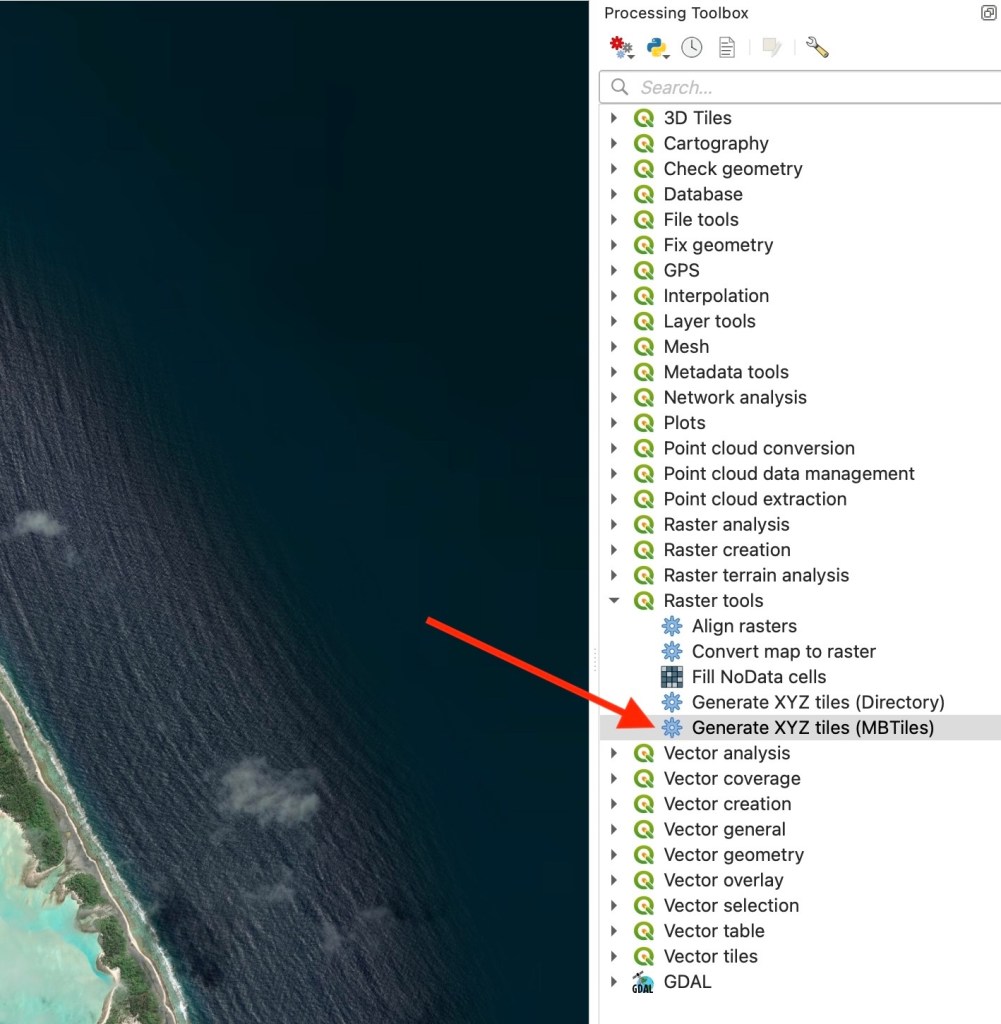
If that dialog opens behind the main QGIS window, ⌘-` will cycle you back to it. Remember this trick because it happens often in QGIS.
Use these settings when the dialog appears:
- Extent: Click the down arrow next to the field, choose Draw on Canvas, click the QGIS window’s title bar to bring it forward, and drag a bounding box tightly around your area of interest.
- Minimum zoom:
10 - Maximum zoom:
18. Do not go higher; zoom 19 and up creates massive files fast! - DPI: Leave at
96 - Tile format:
JPG - Quality:
90 - Output: Click the … button next to Output string, choose Save to File. I use the naming convention:
location - image provider.mbtiles. For example,Makemo East - ArcGIS.mbtiles. It will add an.mbtilesextension.
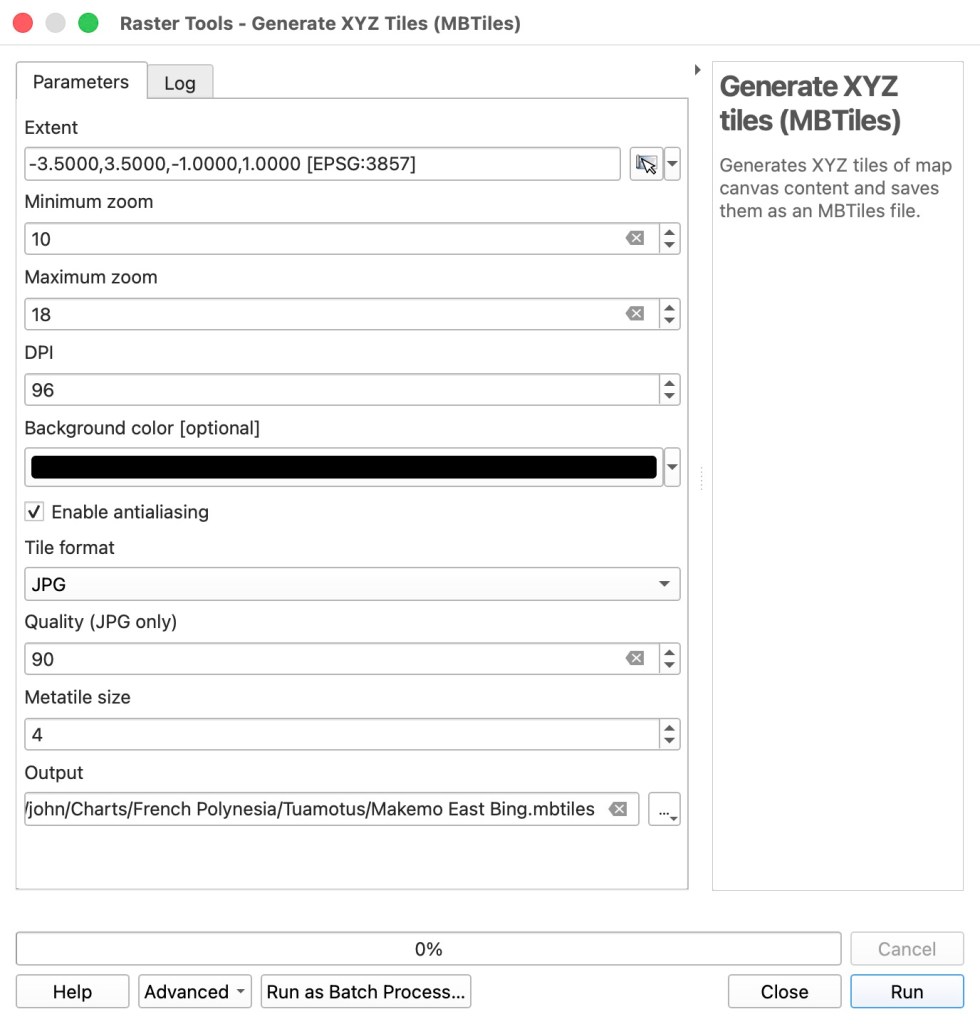
Click Run. QGIS starts downloading every tile within your bounding box at all zoom levels and writing them directly to the .mbtiles SQLite file. Depending on the size of the area you selected, it can take a couple of minutes or considerably longer. Once it’s done, you can close the dialog or draw another extent to generate another tile set right away.
Automating It
I got tired of re-entering the same settings every time, so I built a model that automates the whole thing. You can download and unzip a copy of MBTiles for OCPN.model3.
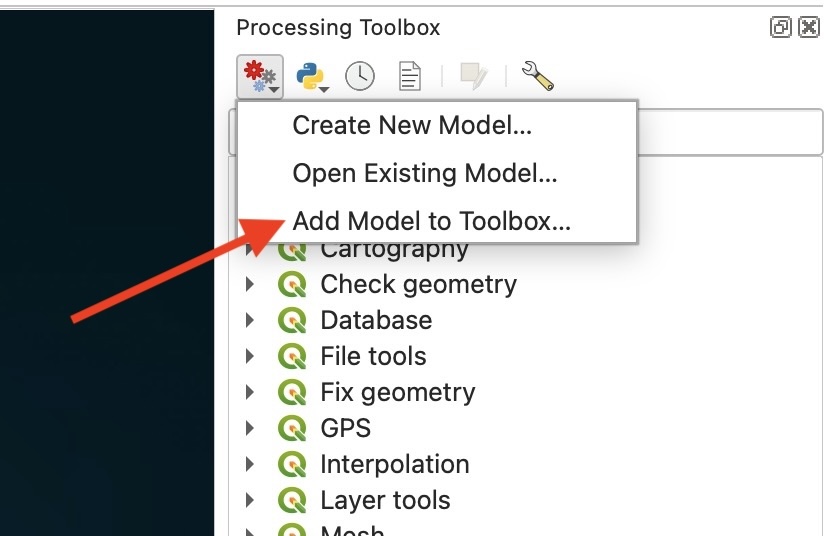
Open the Processing Toolbox menu, select Add Model to Toolbox…, and import my MBTiles for OCPN.model3 file.
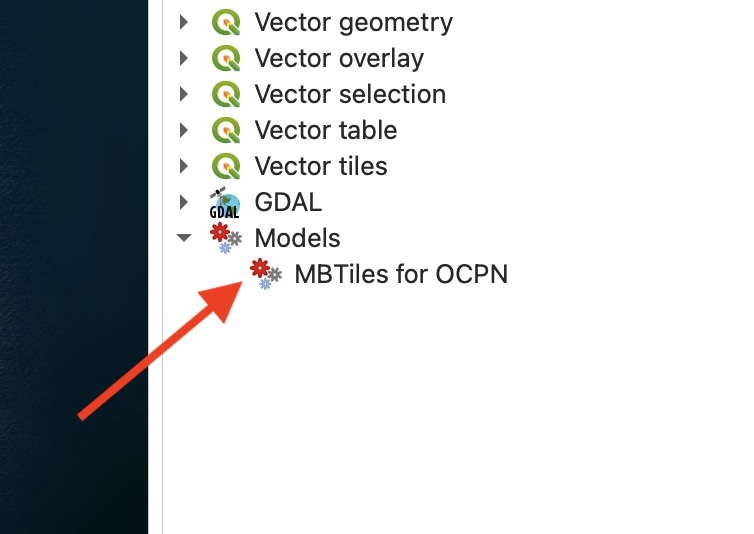
Once it’s added, you’ll find it under Models in the toolbox. From then on, generating a new MBTile is just a matter of running the model, drawing your extent, and naming the output file; it applies all the settings above automatically.
Bringing It Into OpenCPN
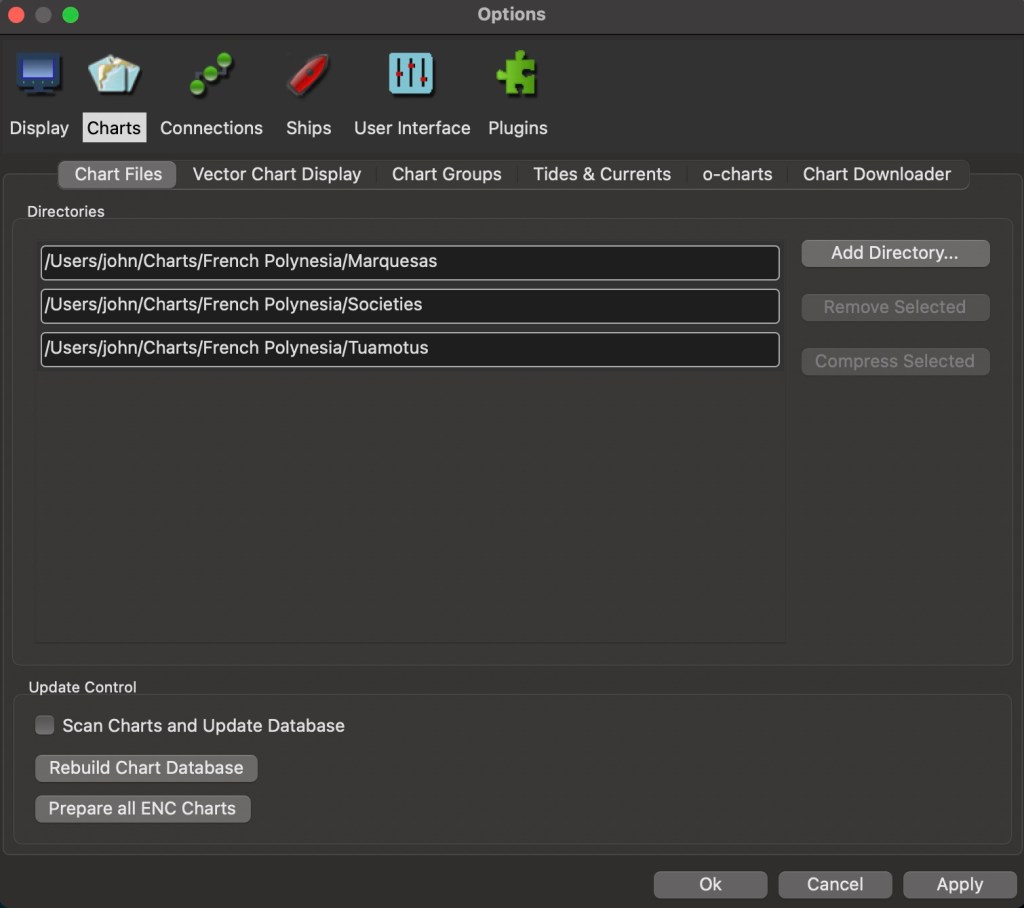
I’m not going to cover importing and using MBTiles in OpenCPN in detail, since that’s already well covered in other tutorials. The short version: add the folder containing your .mbtiles files under Preferences >> Charts >> Chart Files, and OpenCPN will pick up the tile sets inside automatically.
I like to organize mine by country and region, something like Charts/French Polynesia/Tuamotus/.
Building a Track
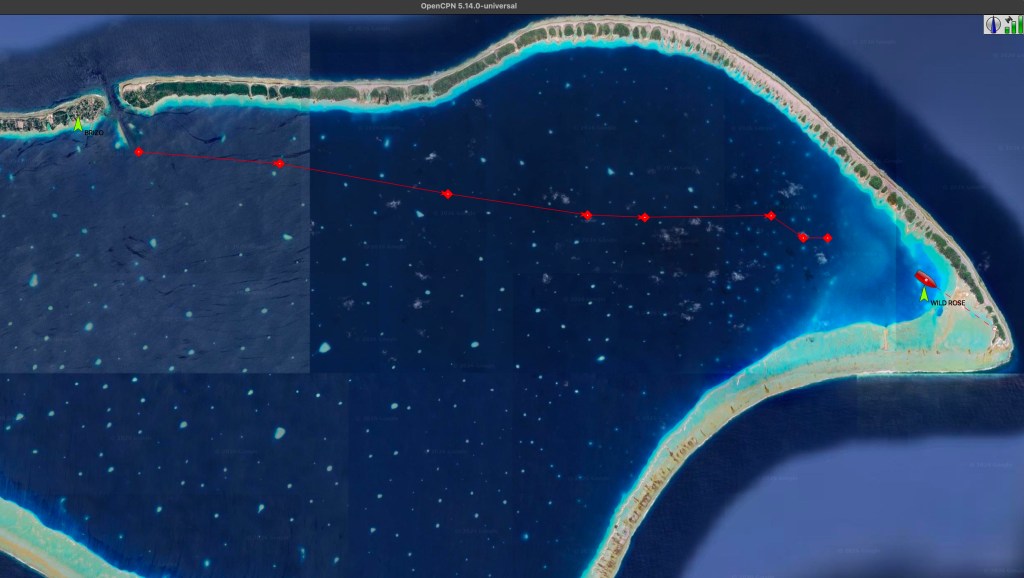
Once your satellite chart is loaded, you can start plotting a route. Keep waypoints to a minimum – every extra turn is another chance to steer straight into a bommie. I’d rather go a bit out of the way to keep the route in open water than thread a bunch of tight turns near coral.
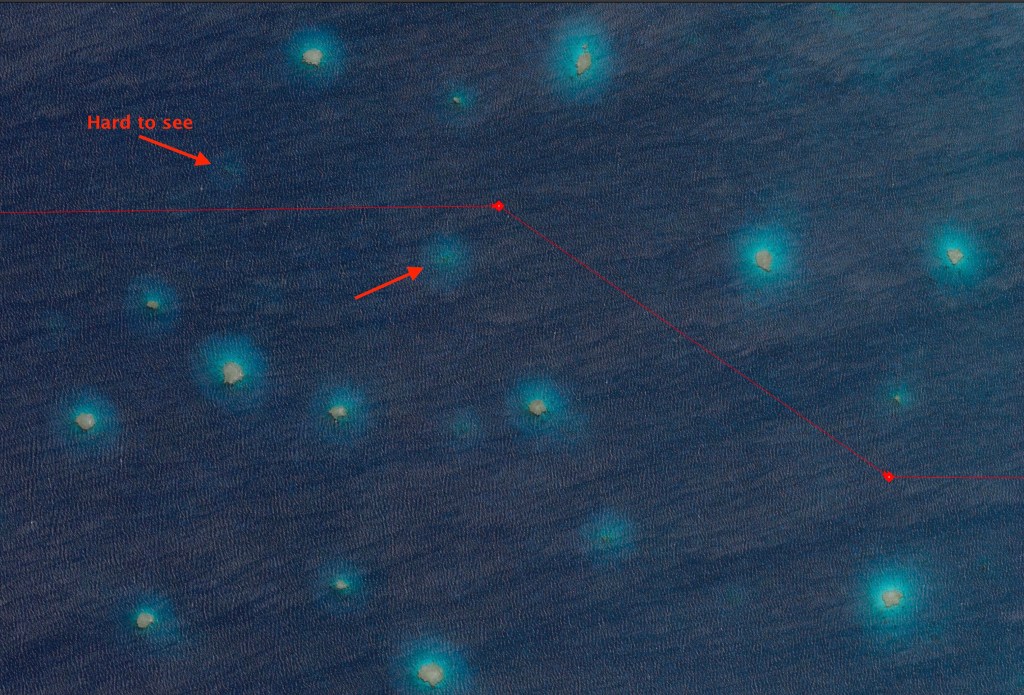
Look closely and zoom in as you go along your route. Small but tall coral heads (bommies) can be surprisingly hard to spot in a satellite image, especially at a normal zoom level. There’s a bommie in the image below that didn’t appear in other satellite images, only in this one. I wasn’t sure how close to the surface it was, and I wasn’t going to sail over it to find out. Situations like this are why I always cross-check a route against more than one image.
In shallow water surrounded by lots of obstacles, I stop relying on the satellite image and switch to eyeball navigation instead and have someone up on the bow looking ahead, which is why my tracks usually end right where the shallow, obstacle-heavy water begins. You can see this in the Route to Eastern Makemo image above. It’s fine to keep using the satellite image in shallow water if there’s a clear, sandy path.
One more tip: turning off Quilting (OpenCPN’s chart-blending display mode) via Option-Q makes it easier to toggle between different image sources while you’re comparing them, since you’ll sometimes see the boundary between two tile sets as you switch.
When I’ve finished creating a route, I export it as a GPX file (the standard route-file format most chartplotters can read) to my B&G plotter so that I can follow it with the autopilot. I also load the satellite MBTiles onto an Android tablet running OpenCPN, so I have them at the helm. On the Mac, I use OpenMTP to transfer the .mbtiles files to the tablet’s charts folder, and the same goes for GPX routes. I prefer to do all my routing on my MacBook Pro with a large, high-resolution screen, but I don’t want my MacBook at the helm.
That’s the whole workflow, from a blank QGIS project to a chart on the tablet at the helm. It takes some setup the first time, but once the connections are in place and my model is installed, generating a new satellite chart for an anchorage or pass takes just a few minutes. It’s saved us more than once in places where the official charts offered nothing useful, and let’s be honest, those are some of the very best places for us to be cruising!
I hope this is helpful to other sailors. Don’t forget to save the “cheatsheet” image at the top of this article. Feel free to drop me a note and let me know if it’s working for you.
 Sailing Coronado
Bless you! I’ve been wanting to do this in a Mac since we got to the South Pacific… Will be using your insights tonight!
LikeLike