
How-To

DIY Satellite Charts for OpenCPN: The Mac Tutorial Nobody Wrote

This is a technical tutorial for sailors who need satellite image charts for remote areas, such as the atolls of French Polynesia, where we are currently cruising. When I looked for tutorials on creating satellite charts for OpenCPN on a Mac, I could only find guides for Windows. There were one or two old Mac tutorials out there, but they were outdated enough that I had to piece together the instructions for the current version of the application I was using to create the chart images. This is that missing Mac guide. And since the tool I’m using works on Windows and Linux too, Windows users will probably find this helpful as well, since most Windows tutorials out there are for software that is just as old and outdated.
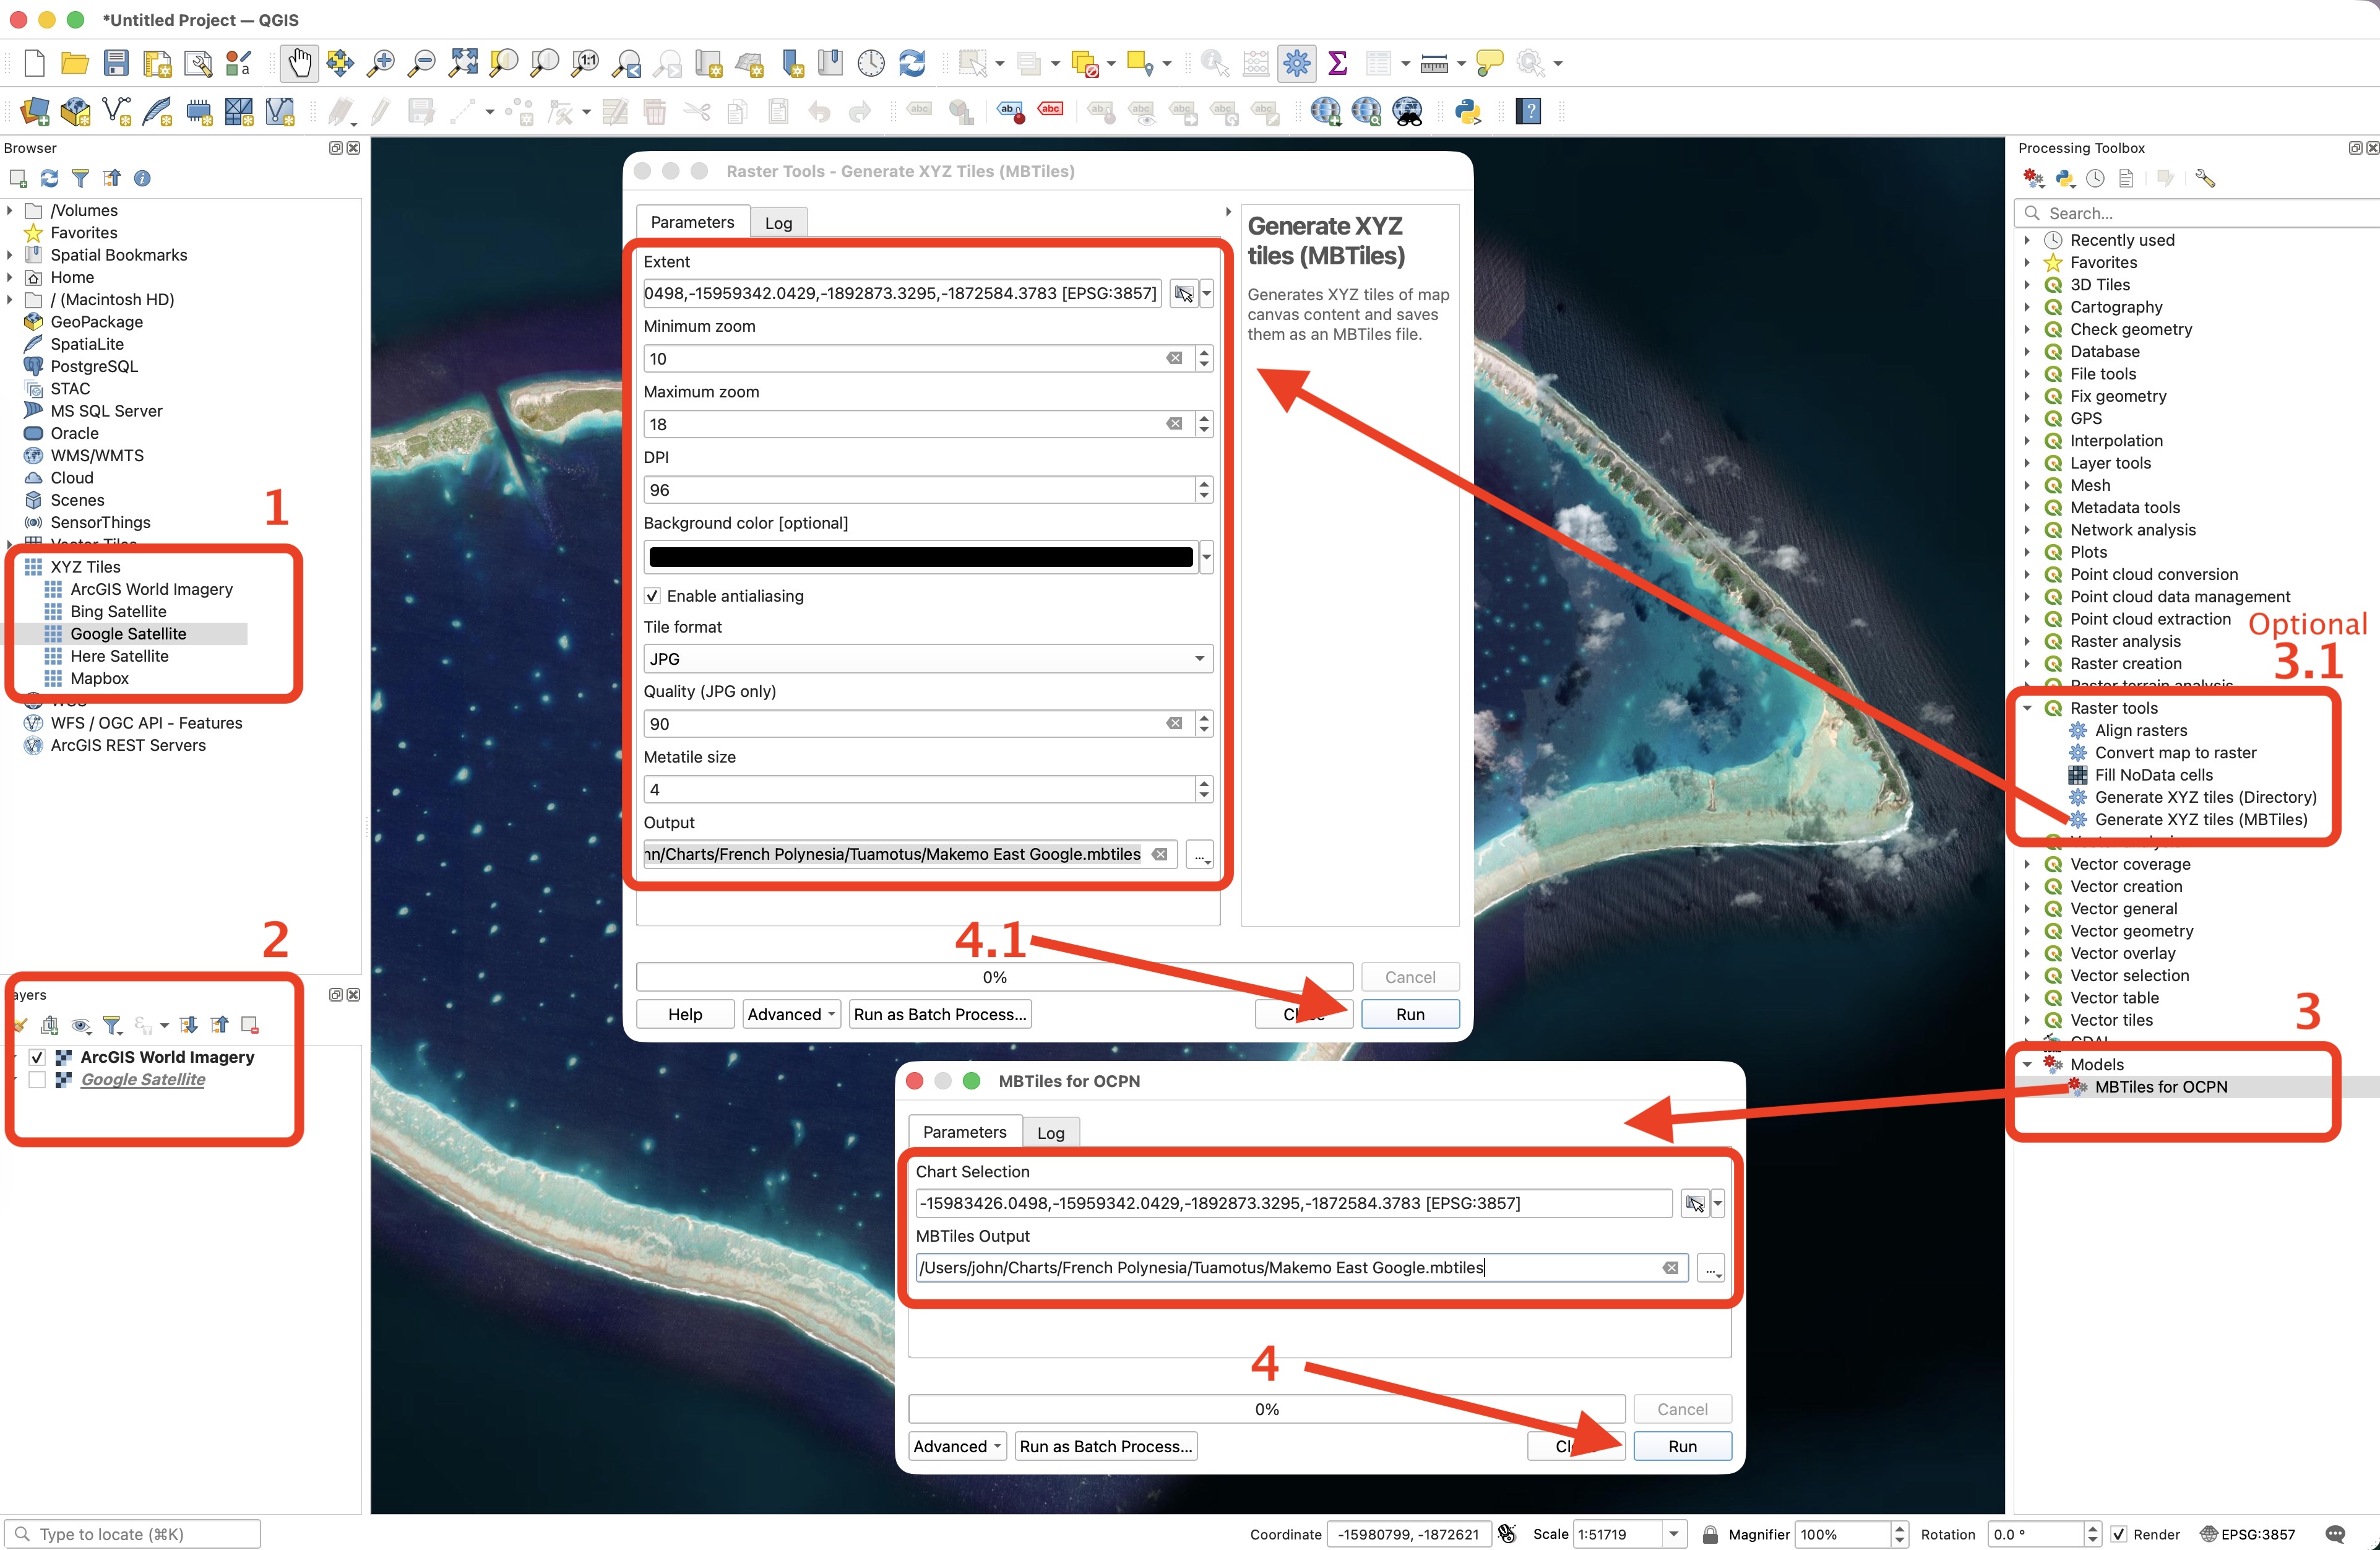
Cheatsheet – Save for Later Reference

Why Use Satellite Images

I’m cruising the Tuamotus in French Polynesia right now, and charts here are either nonexistent or so inadequate they’re almost useless. A decent satellite image shows me things in the water that simply aren’t on the chart. That’s the whole justification for building your own charts instead of relying on someone else’s.

They work beautifully in clear water, the kind you find here in the atolls, where you can see through 20 meters of water. In dark water, like the Chesapeake Bay, a satellite image isn’t helpful. They’re also excellent for finding stationary objects: coral heads, rocks, things that have been sitting in the same spot for decades or centuries. Non-stationary objects like sandbars are trickier. You can see them on a satellite image, but they move over time with currents, so I wouldn’t trust a satellite image to navigate through sandbars. That’s still eyeball navigation territory.

Satellite images in Google Maps might seem like an obvious choice, but it’s not designed for what we’re doing. It has no concept of navigation in open water where there are no roads or paths. You can’t draw a route on it and then follow that route later underway. You need a proper navigation program, like OpenCPN, to do that.

If you’re familiar with using satellite images in OpenCPN for navigation, you might already know you can download ready-made satellite images from sources like The Chart Locker or SoggyPaws, and that’s a valid shortcut. But many of those images were generated years ago. They rely on the creator’s choice of satellite source, which may not be the best available today. They also cover entire regions, so you’re downloading massive amounts of data for places you might never visit.

Creating your own satellite images gives you control over all of that. You can compare multiple satellite sources and pick whichever looks clearest for that specific area on that specific day. You get the latest available imagery, and you create tiles only for the places you actually plan to cruise, which means you’re using a fraction of the disk space you’d need if you downloaded pre-made regional sets.

Why Use OpenCPN and MBTiles

OpenCPN is a full-featured navigation program (you can build routes, track your movement, pull in AIS, all of it), and it’s free. It’s also the program that makes this workflow possible because of how it handles satellite imagery.

When you create your own satellite charts using the process in this article, they’re saved in a format called MBTiles. An MBTiles file is a single file that stores all your captured satellite imagery at multiple zoom levels. Instead of ending up with thousands of individual image tiles scattered across folders, everything for a given area lives in one portable file. You can drop that file straight into OpenCPN, copy it to another device, or back it up, all as one unit. That’s exactly what we want on a boat.

The tool that makes this possible is called QGIS. It’s a free geographic mapping program, and while it’s built for much bigger jobs than ours, we’re only going to use one small piece of it: pulling satellite imagery from a source like ArcGIS or Google and packaging it into a file OpenCPN can read.

Setting Up QGIS

QGIS does the heavy lifting by converting satellite images from different sources into MBtile files. QGIS runs on Mac, Windows, and Linux, and you can download it from QGIS.org (it’s a large file, so downloads can be slow). At the time of this writing, I’m running the Long Term Release, version 3.44.12, so things may change slightly with future versions. Once downloaded, install it in your Applications folder like any other Mac app. Launch the application, then continue reading.

Set the Project CRS

Before doing anything else, you need to set your project’s Coordinate Reference System (CRS) to EPSG:3857 (WGS 84 / Pseudo-Mercator). This is required for MBTiles to work correctly.
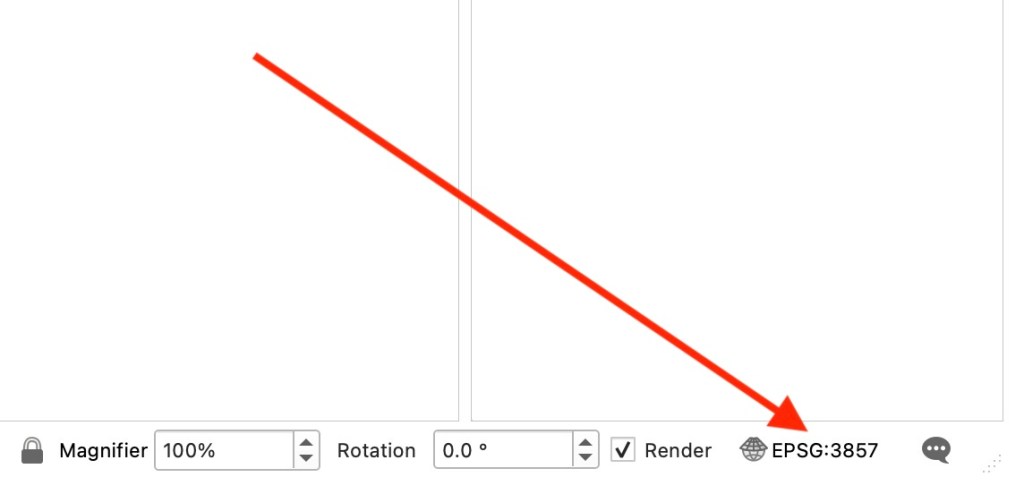
Look at the bottom-right corner of the QGIS window for the current EPSG code and click on it. That opens the Project Properties CRS tab. Type 3857 into the Filter box, select EPSG:3857 โ€“ WGS 84 / Pseudo-Mercator, and click OK. While you’re there, remove any EPSG:4326 entry if one shows up.
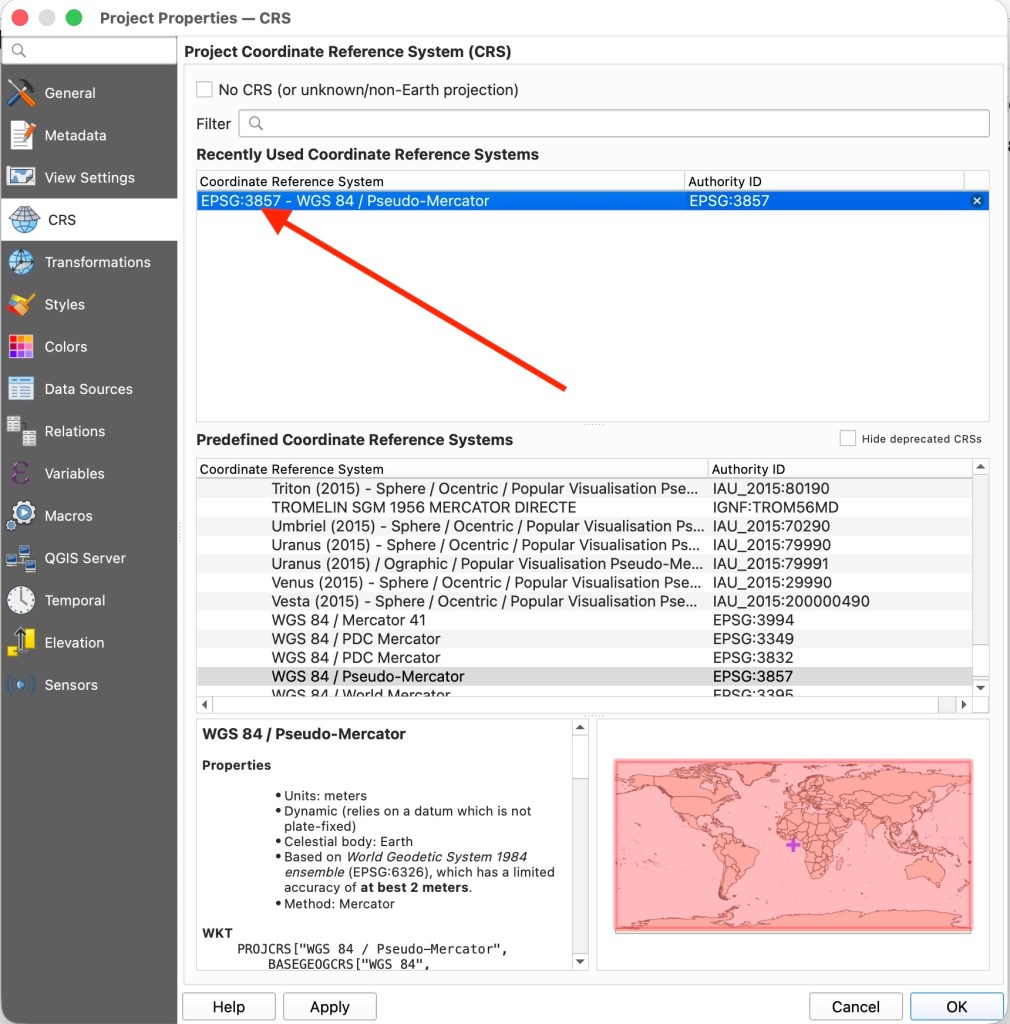
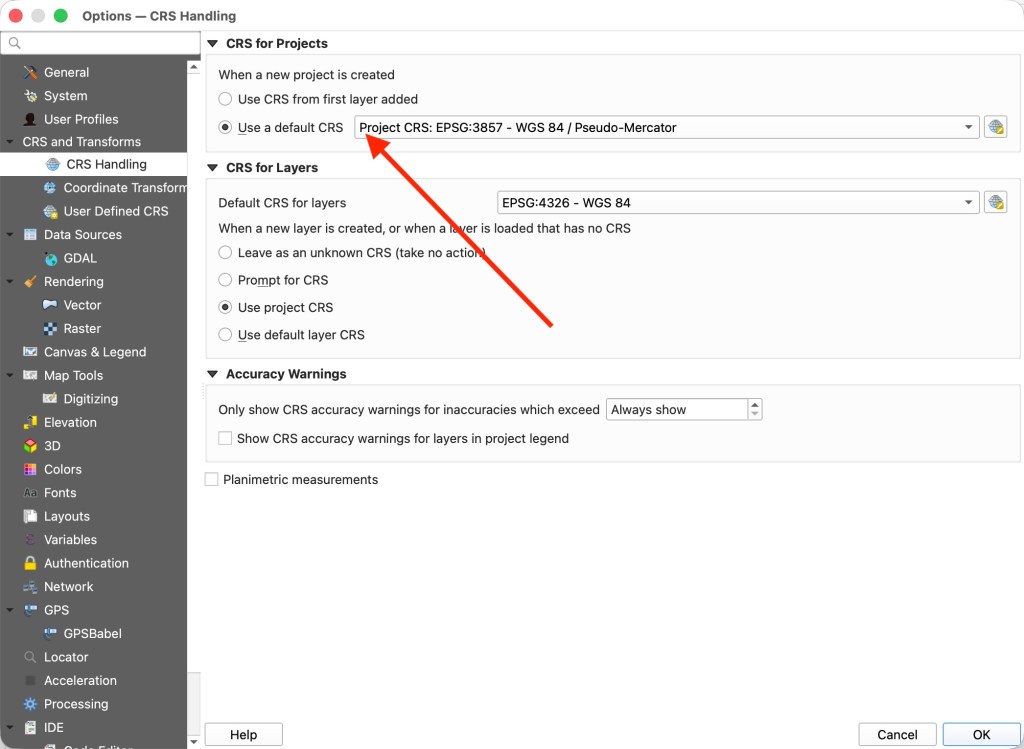
That setting only applies to the current project, though, and I got tired of resetting it every time I opened QGIS. To make it stick, open Preferences from the QGIS menu, go to the CRS Handling tab, and under CRS for Projects, set “When a new project is created” to Use a default CRS, then set it to EPSG:3857 โ€“ WGS 84 / Pseudo-Mercator. Click OK.

Loading Satellite Sources

I’ve preconfigured the connections to several satellite image providers for you, so you don’t have to manually configure each one. The configuration file includes settings for ArcGIS World Imagery, Bing Satellite, and Google Satellite, the three most popular.

Download and unzip a copy of my XYZ Tiles Connections.xml file to your computer. (Note: On a Mac, it will unzip this file automatically, if you are on a Windows machine, you will need to unzip it first.)

Now right-click XYZ Titles in the Browser panel (on the left side of the screen) and load my connections file, selecting all three sources: ArcGIS World Imagery, Bing Satellite, and Google Satellite.
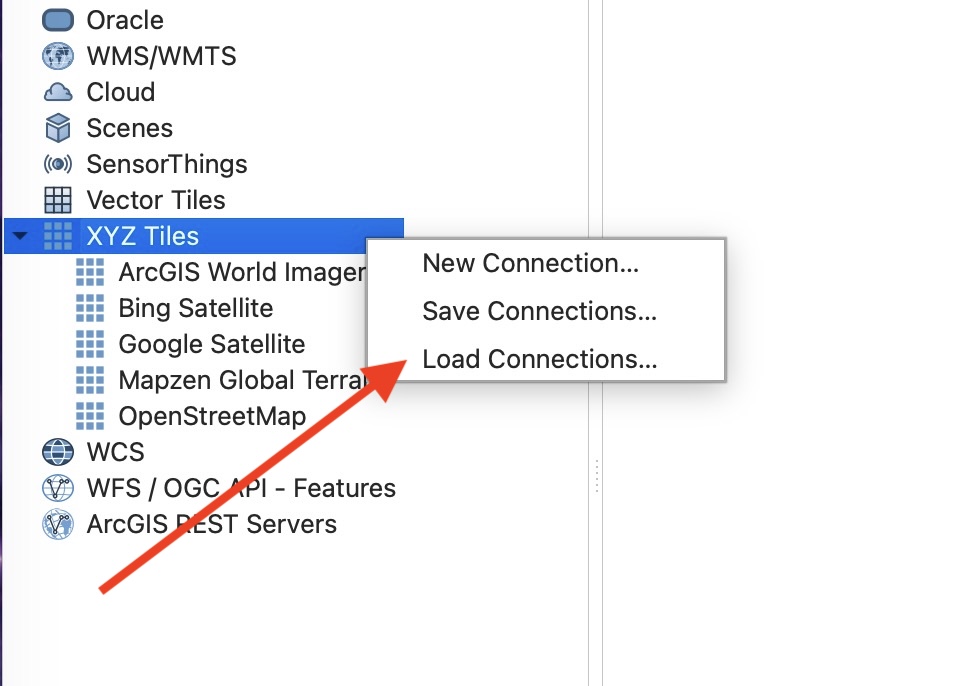
XYZ Tiles Connections

Once imported, you’ll see all three listed under XYZ Tiles, along with Mapzen Global Terrain and OpenStreetMap, which come installed by default (and you can ignore).

XYZ Tiles gets its name from how each map image is addressed: by column (X), row (Y), and zoom level (Z). It’s the connection type QGIS uses for ArcGIS, Bing, Google, and other satellite image providers.

Mapbox and HERE are also excellent sources for satellite images, but they require a free account and an API key. If you’re comfortable with that, you can add them as XYZ connections using these URL templates with your own key dropped in. Do not change the URLs other than adding in the API keys. Otherwise, you can read on and come back to this later.

https://api.mapbox.com/v4/mapbox.satellite/{z}/{x}/{y}.jpg?access_token=<YOUR ACCESS TOKEN HERE>
https://maps.hereapi.com/v3/base/mc/{z}/{x}/{y}/jpeg?style=satellite.day&apiKey=<YOUR API KEY HERE>

Comparing Sources

Open one of the satellite layers (I usually start with ArcGIS) and zoom into the area you’re interested in capturing. You can use the zoom buttons on the toolbar, or on a Mac, use the two-finger up-and-down gesture. The pinch gesture doesn’t work like it does on a phone. Then add a second source, like Bing, on top of it.

The topmost selected layer in your Layers panel is the one you’ll see on the canvas. You can toggle between sources by dragging them up or down in the layer order or by unchecking the layers you don’t want to see. You can remove any you don’t want using the delete icon.
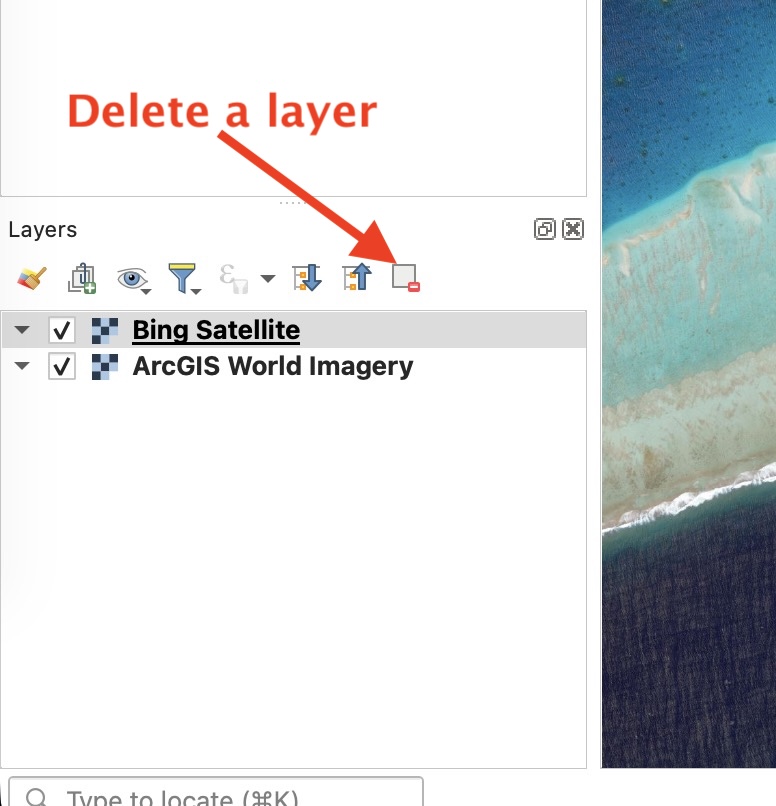
Reorder and Delete Image Layers

It’s worth reviewing multiple sources rather than settling on one. Different providers capture imagery at different times, so you’ll see varying tide levels, sun angles, and cloud cover. One source might have a cloud right over the pass you need to see, while another might not. It’s rare that a single image is best for the entire route. I usually create MBTiles from multiple images and toggle between them as I’m creating my route.

Generating the MBTile

Whichever image is visible on the canvas when you generate the tile set is the one that gets exported, so make sure the layer you want on top is the one showing.

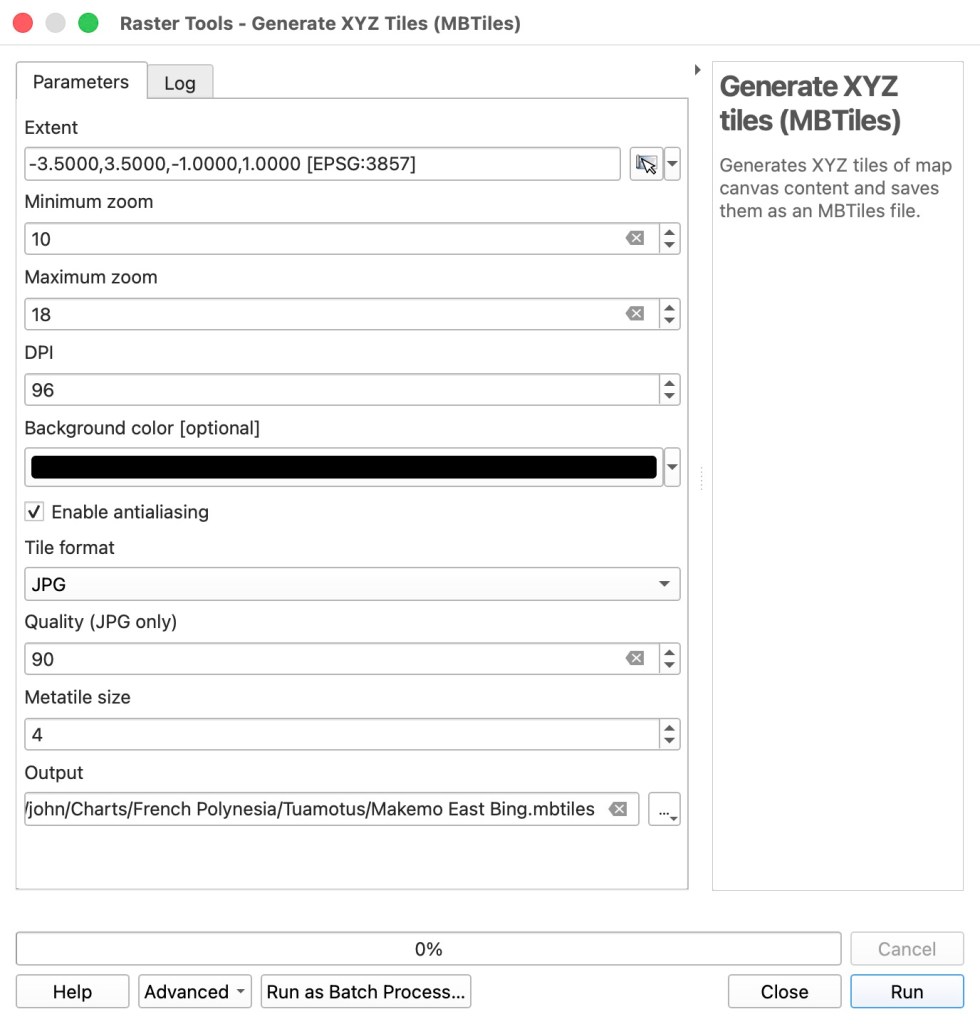
Open the Processing Toolbox by clicking Processing >> Toolbox in the top menu. Under Raster tools, double-click Generate XYZ tiles (MBTiles). Note: Don’t use the Vector tools version, which is a common mix-up.
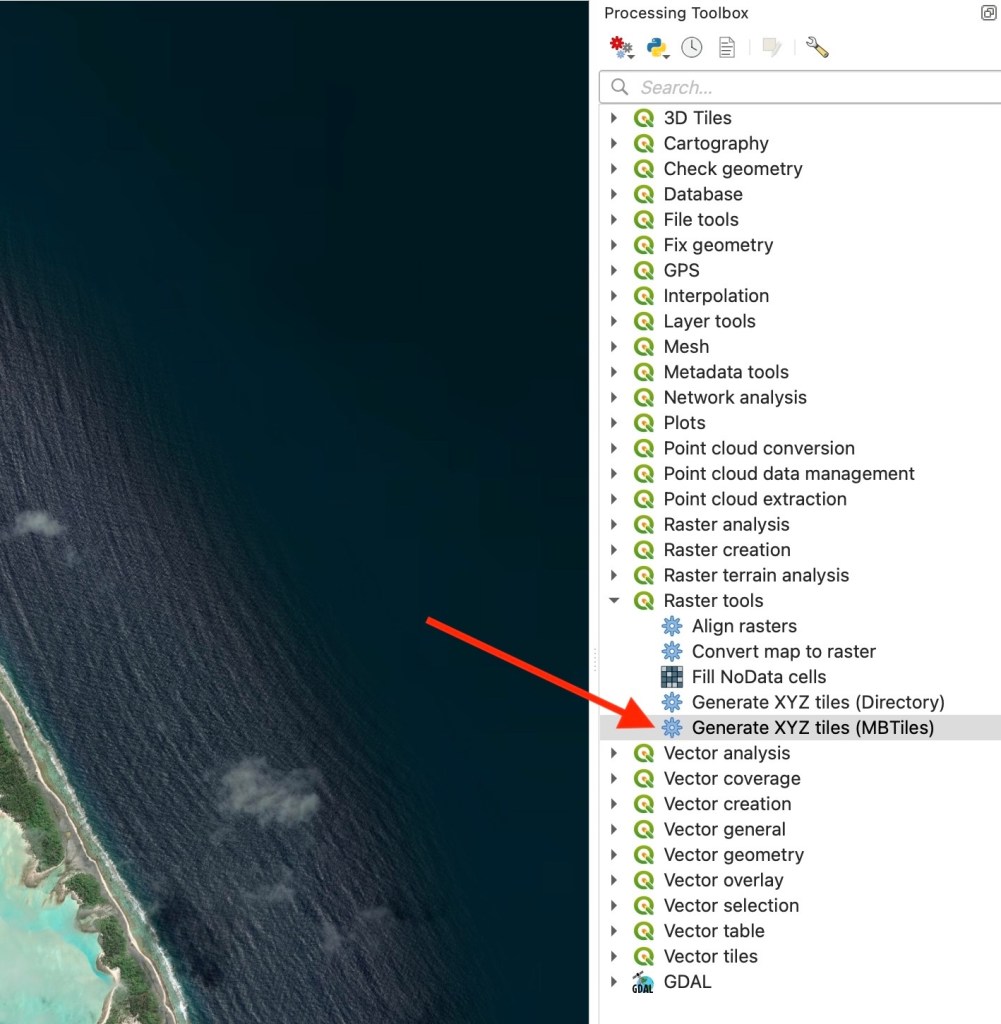
Raster tools – Generate XYZ tiles (MBTiles)

If that dialog opens behind the main QGIS window, โŒ˜-` will cycle you back to it. Remember this trick because it happens often in QGIS.

Use these settings when the dialog appears:

  • Extent: Click the down arrow next to the field, choose Draw on Canvas, click the QGIS window’s title bar to bring it forward, and drag a bounding box tightly around your area of interest.
  • Minimum zoom: 10
  • Maximum zoom: 18. Do not go higher; zoom 19 and up creates massive files fast!
  • DPI: Leave at 96
  • Tile format: JPG
  • Quality: 90
  • Output: Click the โ€ฆ button next to Output string, choose Save to File. I use the naming convention: location - image provider.mbtiles. For example, Makemo East - ArcGIS.mbtiles. It will add an .mbtiles extension.
MBTile Output File Settings

Click Run. QGIS starts downloading every tile within your bounding box at all zoom levels and writing them directly to the .mbtiles SQLite file. Depending on the size of the area you selected, it can take a couple of minutes or considerably longer. Once it’s done, you can close the dialog or draw another extent to generate another tile set right away.

Automating It

I got tired of re-entering the same settings every time, so I built a model that automates the whole thing. You can download and unzip a copy of MBTiles for OCPN.model3.

Open the Processing Toolbox menu, select Add Model to Toolboxโ€ฆ, and import my MBTiles for OCPN.model3 file.
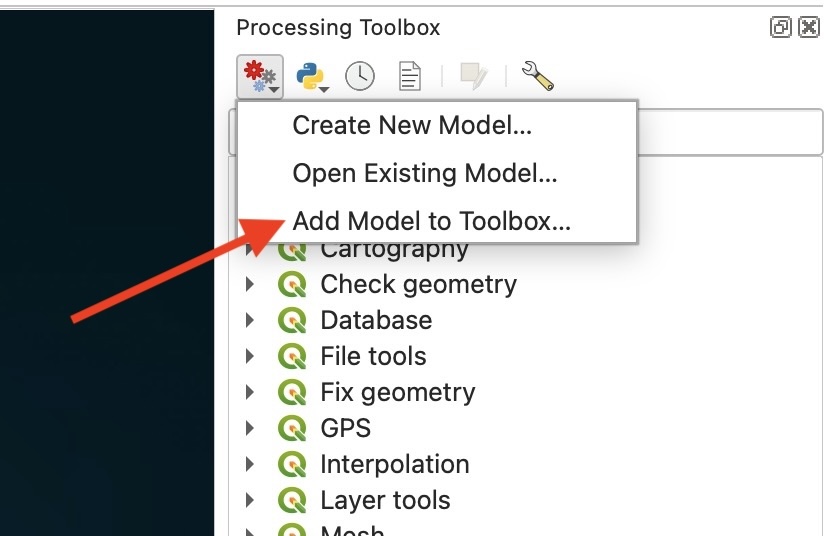
Add Model to Toolbox…

Once it’s added, you’ll find it under Models in the toolbox. From then on, generating a new MBTile is just a matter of running the model, drawing your extent, and naming the output file; it applies all the settings above automatically.
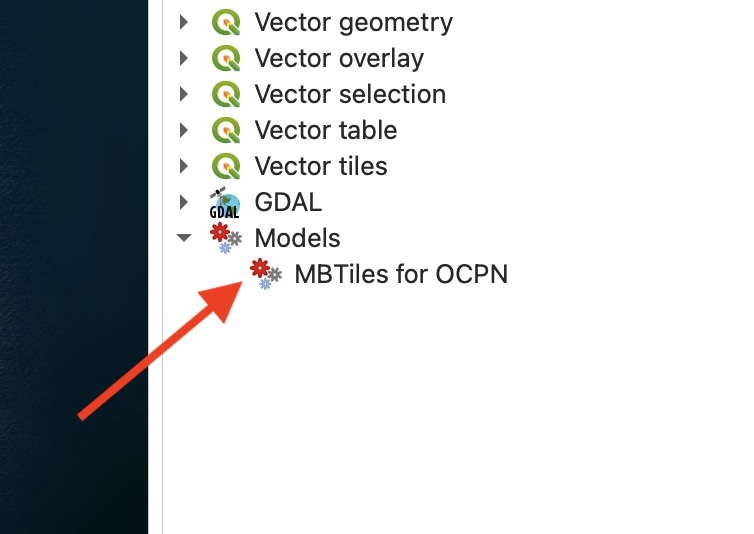
Run MBTiles for OCPN

Bringing It Into OpenCPN

I’m not going to cover importing and using MBTiles in OpenCPN in detail, since that’s already well covered in other tutorials. The short version: add the folder containing your .mbtiles files under Preferences >> Charts >> Chart Files, and OpenCPN will pick up the tile sets inside automatically.

I like to organize mine by country and region, something like Charts/French Polynesia/Tuamotus/.
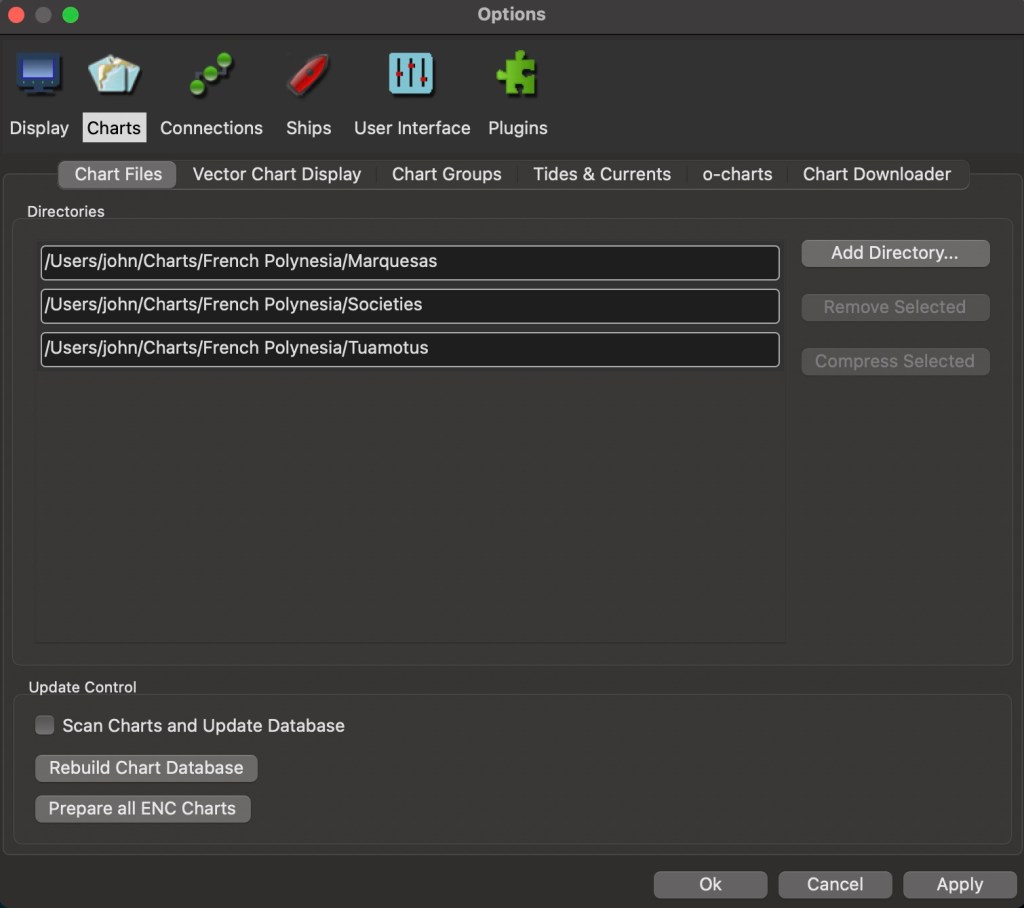
Adding MBTiles to OpenCPN

Building a Track

Once your satellite chart is loaded, you can start plotting a route. Keep waypoints to a minimum – every extra turn is another chance to steer straight into a bommie. I’d rather go a bit out of the way to keep the route in open water than thread a bunch of tight turns near coral.
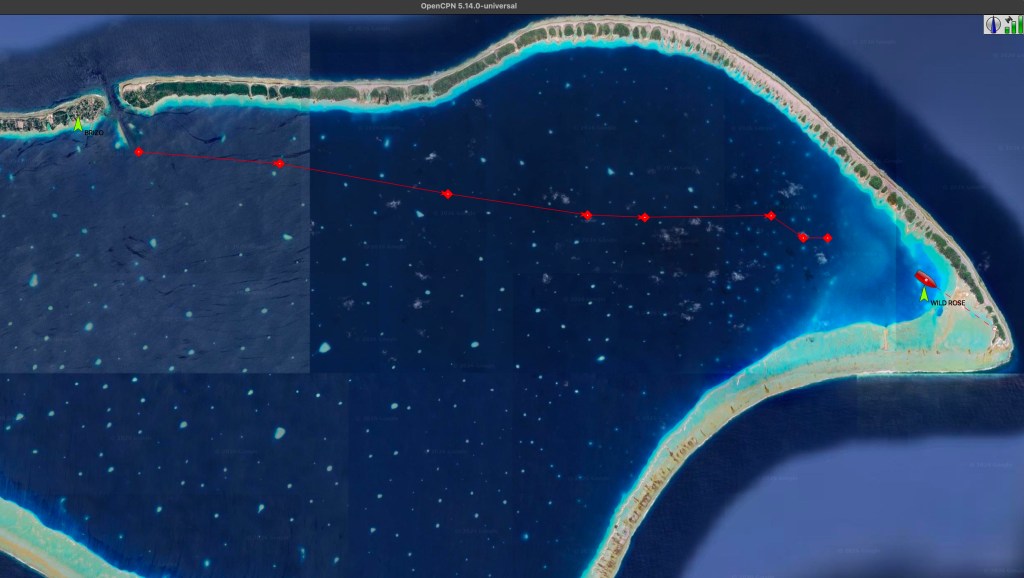
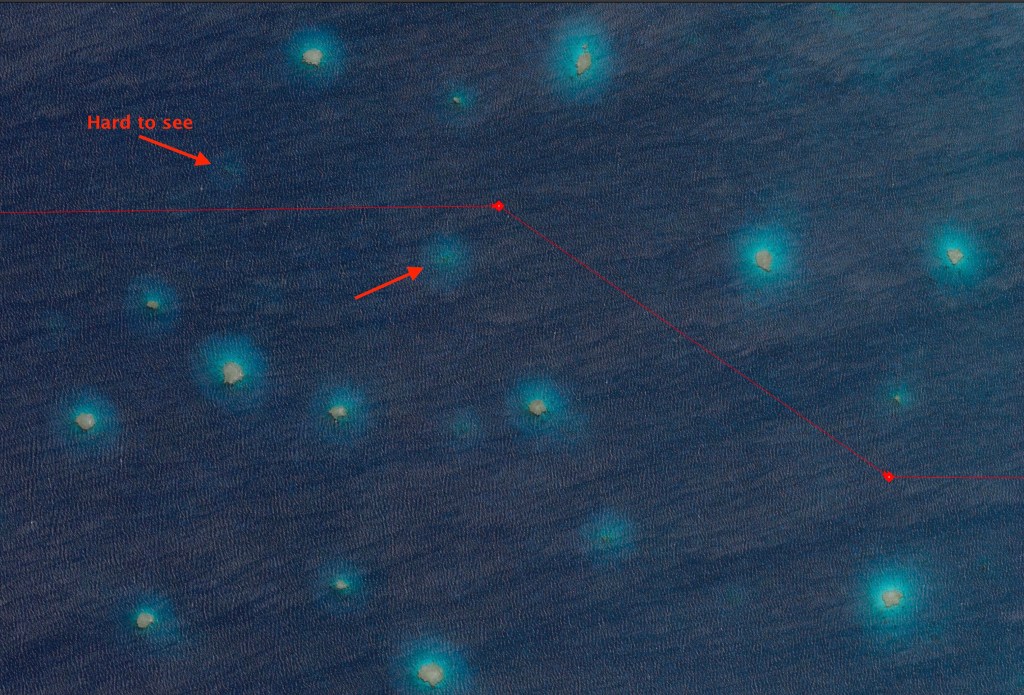
Look closely and zoom in as you go along your route. Small but tall coral heads (bommies) can be surprisingly hard to spot in a satellite image, especially at a normal zoom level. There’s a bommie in the image below that didn’t appear in other satellite images, only in this one. I wasn’t sure how close to the surface it was, and I wasn’t going to sail over it to find out. Situations like this are why I always cross-check a route against more than one image.
In shallow water surrounded by lots of obstacles, I stop relying on the satellite image and switch to eyeball navigation instead and have someone up on the bow looking ahead, which is why my tracks usually end right where the shallow, obstacle-heavy water begins. You can see this in the Route to Eastern Makemo image above. It’s fine to keep using the satellite image in shallow water if there’s a clear, sandy path.

One more tip: turning off Quilting (OpenCPN’s chart-blending display mode) via Option-Q makes it easier to toggle between different image sources while you’re comparing them, since you’ll sometimes see the boundary between two tile sets as you switch.

When I’ve finished creating a route, I export it as a GPX file (the standard route-file format most chartplotters can read) to my B&G plotter so that I can follow it with the autopilot. I also load the satellite MBTiles onto an Android tablet running OpenCPN, so I have them at the helm. On the Mac, I use OpenMTP to transfer the .mbtiles files to the tablet’s charts folder, and the same goes for GPX routes. I prefer to do all my routing on my MacBook Pro with a large, high-resolution screen, but I don’t want my MacBook at the helm.


That’s the whole workflow, from a blank QGIS project to a chart on the tablet at the helm. It takes some setup the first time, but once the connections are in place and my model is installed, generating a new satellite chart for an anchorage or pass takes just a few minutes. It’s saved us more than once in places where the official charts offered nothing useful, and let’s be honest, those are some of the very best places for us to be cruising!

I hope this is helpful to other sailors. Don’t forget to save the “cheatsheet” image at the top of this article. Feel free to drop me a note and let me know if it’s working for you.
Uncategorized

How We Approach Passage Planning

Passage planning is a crucial aspect of any sailing journey, requiring careful consideration of weather conditions, route optimization, and boat performance. In this blog post, I will share my approach to weather passage planning using the Professional version of PredictWind, which has become an integral part of my workflow. While I am not a meteorologist and have no formal training beyond books and personal experience, I have developed a method that has proven effective over numerous voyages. This method combines pre-departure planning, real-time adjustments, and post-passage analysis to continually refine my technique. I have no affiliation with PredictWind, it is just the best tool I have found.

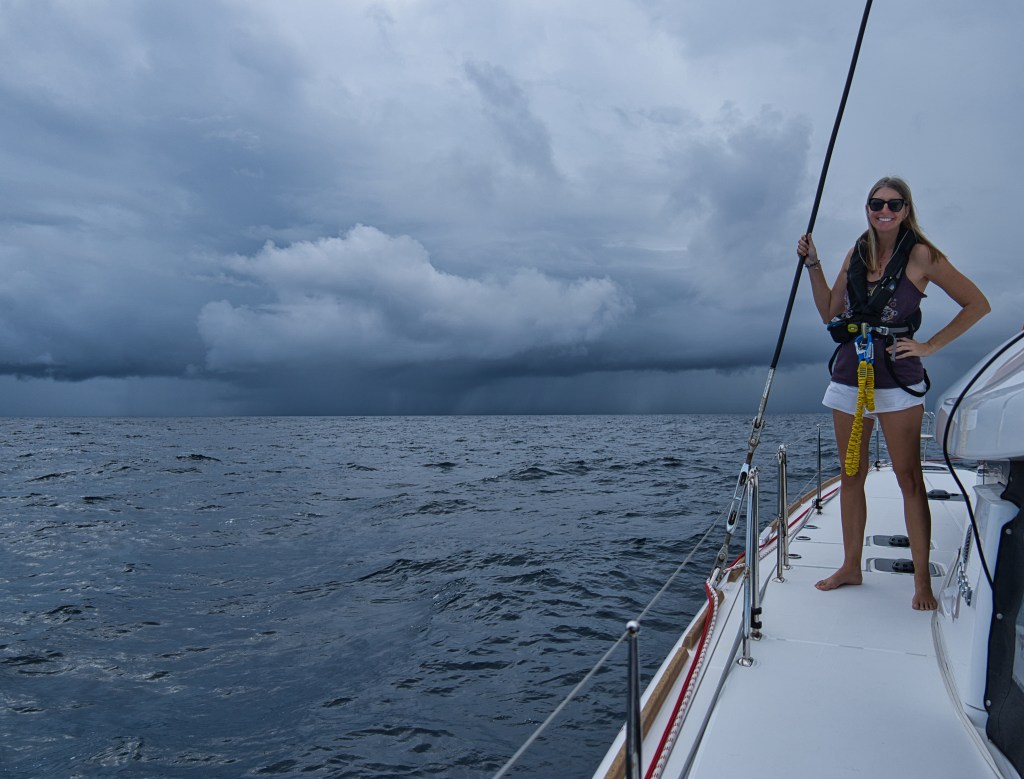
A squall in the middle of the Atlantic Ocean

Weather Models

One misunderstanding I see many sailors make is the belief that one app or website provides a better forecast than another. This belief is usually untrue since most weather apps use the same weather data provided by the ECMWF (European Centre for Medium-Range Weather Forecasts) or the United States National Weather Service (GFS). The difference between the apps is only how the data is presented. Saying one app has a better forecast than another is like saying Taylor Swiftโ€™s Shake It Off is better on Apple Music than Spotify when itโ€™s the same song provided by two different services. The weather apps I prefer to use are Windy and PredictWind. I like Windy’s user interface and how the weather data is organized. I use Windy daily to check the weather and to look at the weather on a macro scale to see the movement of high and low-pressure systems, fronts, etc. On the other hand, the Professional version of PredictWind is the app I use for passage planning. In my opinion, PredictWind is hard to beat when determining when to depart, the route to take, and the conditions expected along the way. Since this post is about passage planning and not an overview of the weather, Iโ€™ll talk about how I use PredictWind and show screenshots from their website.

Setting Up PredictWind

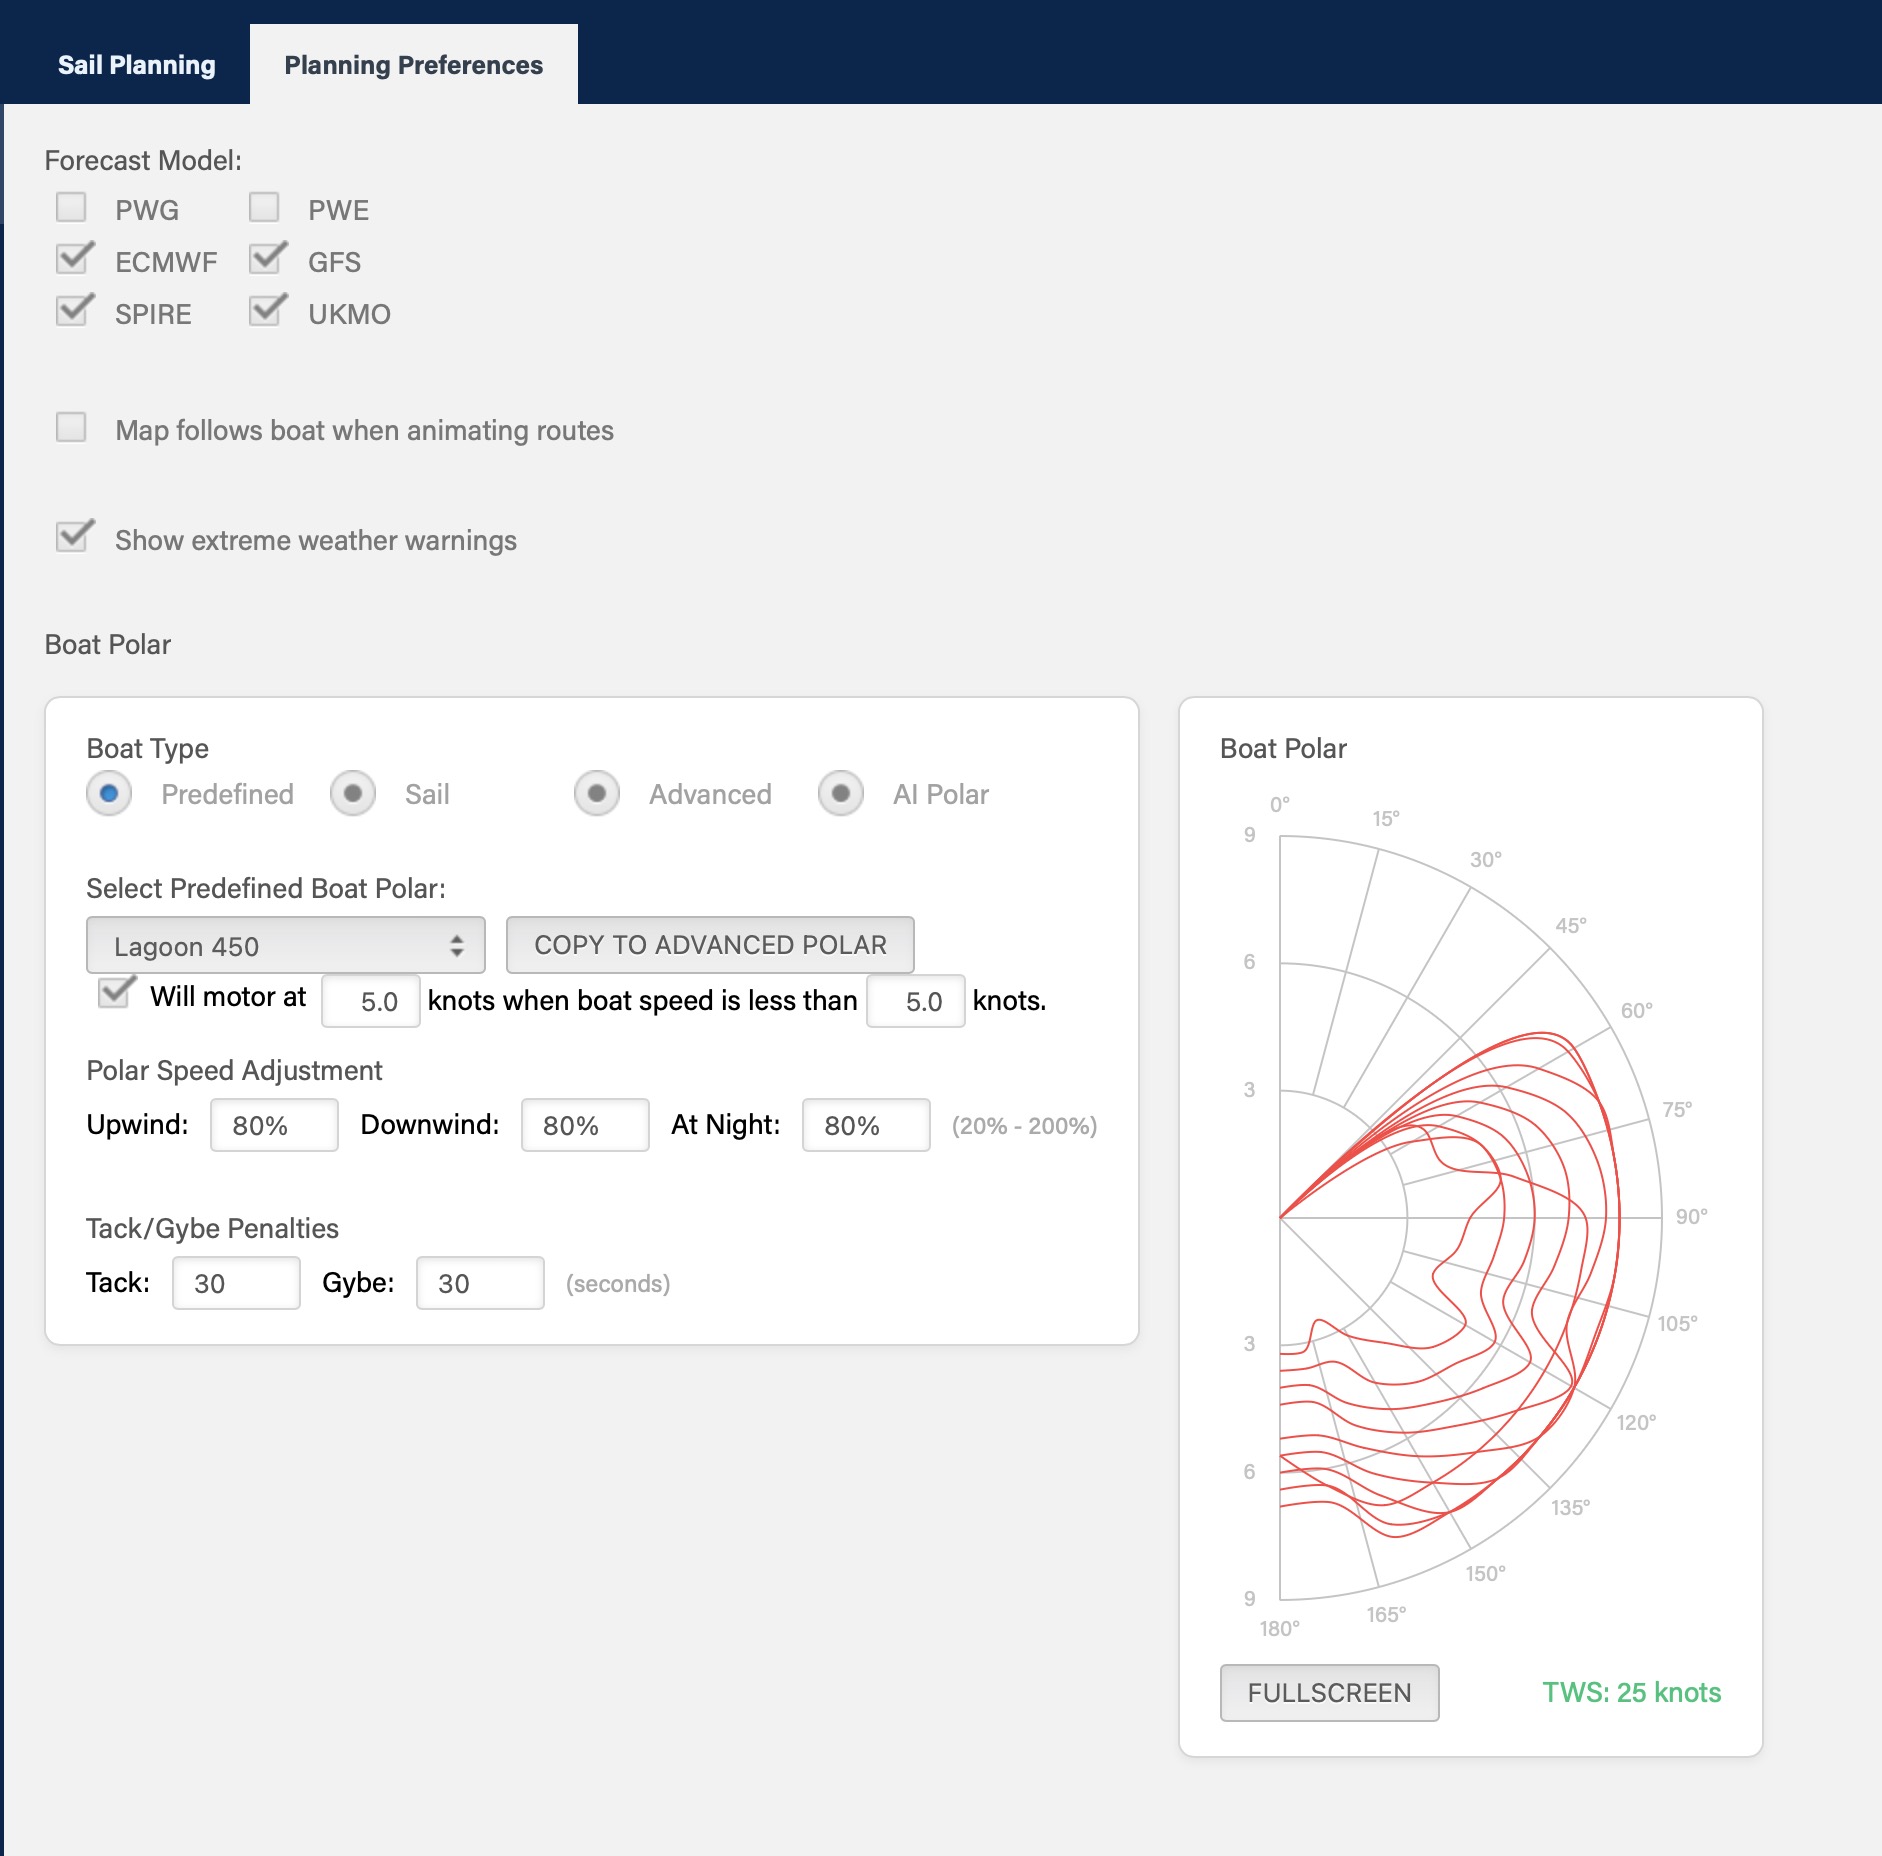
One of the powerful features of PredictWind is that it suggests a route optimized for your boat. I have heard people complain that PredictWindโ€™s weather routing doesnโ€™t work well, but that is usually because they donโ€™t have their boat polars set correctly in the application. I admit this is frustrating at first and takes some time to get right, but itโ€™s critical for the application to produce an optimized route. As I mentioned, I save my initial routing information and reflect on it at the end of the passage. This is when I end up tweaking my polars so future routing will match more closely to what I sailed. For example, we sail to about 80% of the factory polar provided by PredictWind for the Lagoon 450. We are a bit faster than the 80% numbers, but I want to error on the side of being conservative. It also doesnโ€™t consider that we have a Code 0 and a spinnaker, so our light air performance is much better than they predicted. We rarely follow their suggested route exactly, choosing to sail dead downwind instead of gybing back and forth. We also motor less than they predict over long distances and motor more over short distances. With all this said, PredictWindโ€™s routing gets me about 85% of the way there, and I use my expert knowledge about how we sail compared to their recommended route to fill in the rest. The takeaway is to invest some time into getting the boat’s polar data close to reality. Otherwise, PredictWindโ€™s recommended route will be way off.

(Side note: Iโ€™m currently logging all our NMEA 2000 passage data to a database with the plan to build a custom boat polar instead of using the predefined polar in PredictWind. PredictWind has a product called the DataHub, which is supposed to do this for you, but Iโ€™m skeptical it will work well.)

Boat Polar Input Screen

Departure Planning

For this blog post, I will use a real-world passage we completed when we sailed from Green Turtle Cay in the Abacos to the Chesapeake. We planned to haul out Coronado at Zimmermanโ€™s in Matthews, VA, at the end of May. We planned to be able to leave from The Bahamas to the Chesapeake starting at the beginning of May. That gave us four weeks to find a suitable weather window. Experience has taught us that the higher the latitude, the harder it is to find good weather for a time period long enough to make a journey more than a few days. We wanted to make the 750 nautical mile trip in one shot but knew we would likely have to sail north part of the way, anchor for a while, and wait for good weather to finish the trip. To spoil the end of the story, in this particular passage, we made it to Mathews, Virginia, on the Chesapeake Bay in one trip.

Once we arrived in the Abacos, I started looking for a weather window using the Departure Planning feature in PredictWind. This feature runs four iterations of the passage over a user-specified period of time. When I started looking for a suitable date to depart, I set the time period to be 24 hours, producing four passages separated by one day. I can compare the days to see if day one, two, three or four is preferrable for departing. Remember that I rarely find a perfect departure day, especially the longer the distance. Itโ€™s always a compromise between wind speed, wind angle, sea state, and the general state of the weather (usually thunderstorms). Experience has taught us to take the first decent weather window. If you wait for the weather to be perfect, you risk wasting a lot of time. We typically donโ€™t compromise on rough seas on the quarter, sailing upwind (unless the air is light) and if there are severe thunderstorms. High wind and large following seas arenโ€™t our favorite sailing conditions, but theyโ€™re manageable. Anna gets seasick when the seas hit us on the quarter, and the boat sloshes around like a washing machine. Itโ€™s worse when it occurs on the first or second day before she has her sea legs. Time and experience will help you understand which conditions you and your crew can tolerate and which you canโ€™t.

Depart Data 24 hours Apart

Donโ€™t pick a start date too far into the future when using Departure Planning. The weather forecast is usually only accurate for about 72 hours from the last forecast; after that, it becomes a guess. When looking at forecasts, know that weather models are better at predicting how an already established pressure system or front will evolve than predicting where and when a new pressure system or front will form. The further into the future you look at the weather, the more likely youโ€™re looking at the latter prediction than the former, which becomes more of an issue when youโ€™re looking at longer passages. The weather at the end of your passage is a big unknown if youโ€™re looking at departing four days from today to do a five-day passage. The weather on the final day of the passage is now nine days into the future! This is why even when it appears I have a great weather window; I keep running the Departure Planning models every day to see the trend. There have been numerous times Iโ€™ve told Anna, โ€œWeโ€™re leaving on Friday, be preparedโ€ฆโ€ only to say on Thursday night, โ€œIโ€™ve changed my mind, weโ€™re leaving on Sunday insteadโ€ฆโ€ This brings up an important point: a good sailor will change their mind on the departure date if the forecast starts trending negatively; a bad sailor will leave anyway just because theyโ€™re committed.

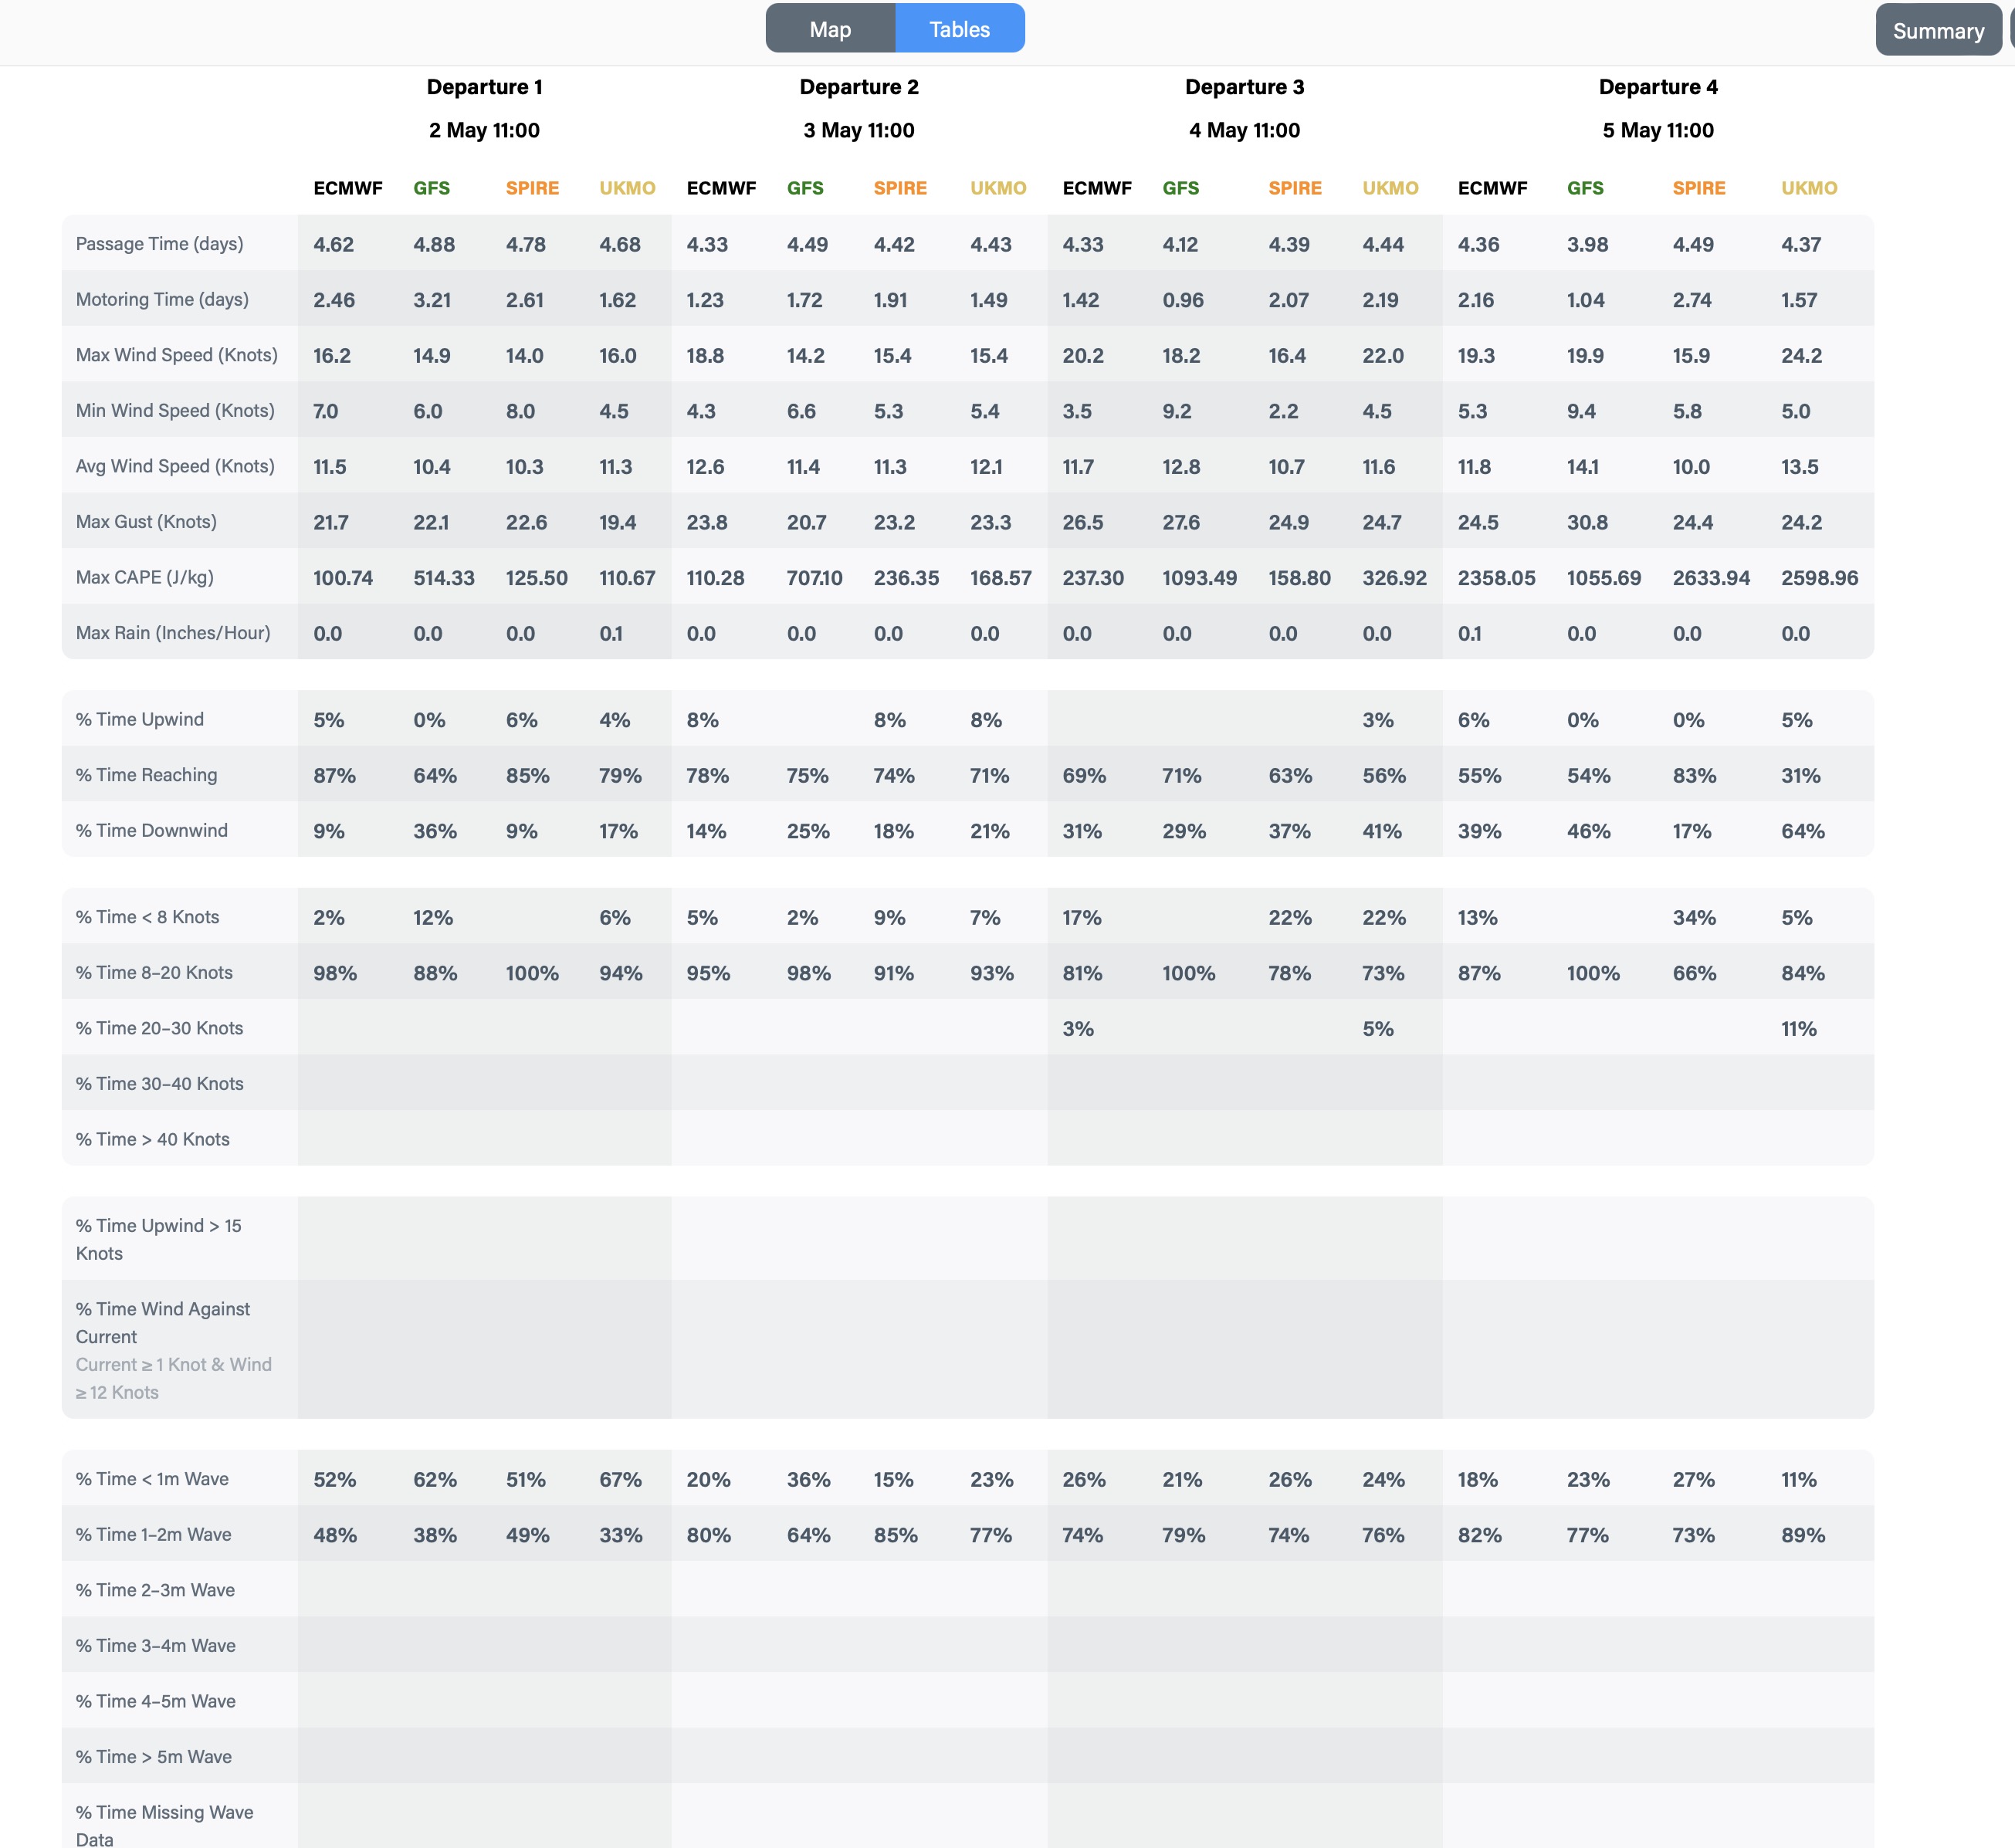
When you run Departure Planning, you must select four weather models out of six to calculate the route. The models are ECMWF, GFS, Spire, UKMO, PWE and PWG. (For more information on each weather model, click here.) I find the ECMWF to be the best all-around and consistently good. If Iโ€™m sailing short distances near land, I use the PWE and PWG models since they include the effects of land on wind speed and direction. Offshore, I find Spire to be good, and GFS is excellent at predicting tropical storms, so Iโ€™ll include them instead of PWE and PWG. If I see one model way off compared to the other three, Iโ€™ll likely swap it out for another. Keep in mind that the four model limitation is only for Departure Planning. The Weather Routing feature uses all six models.

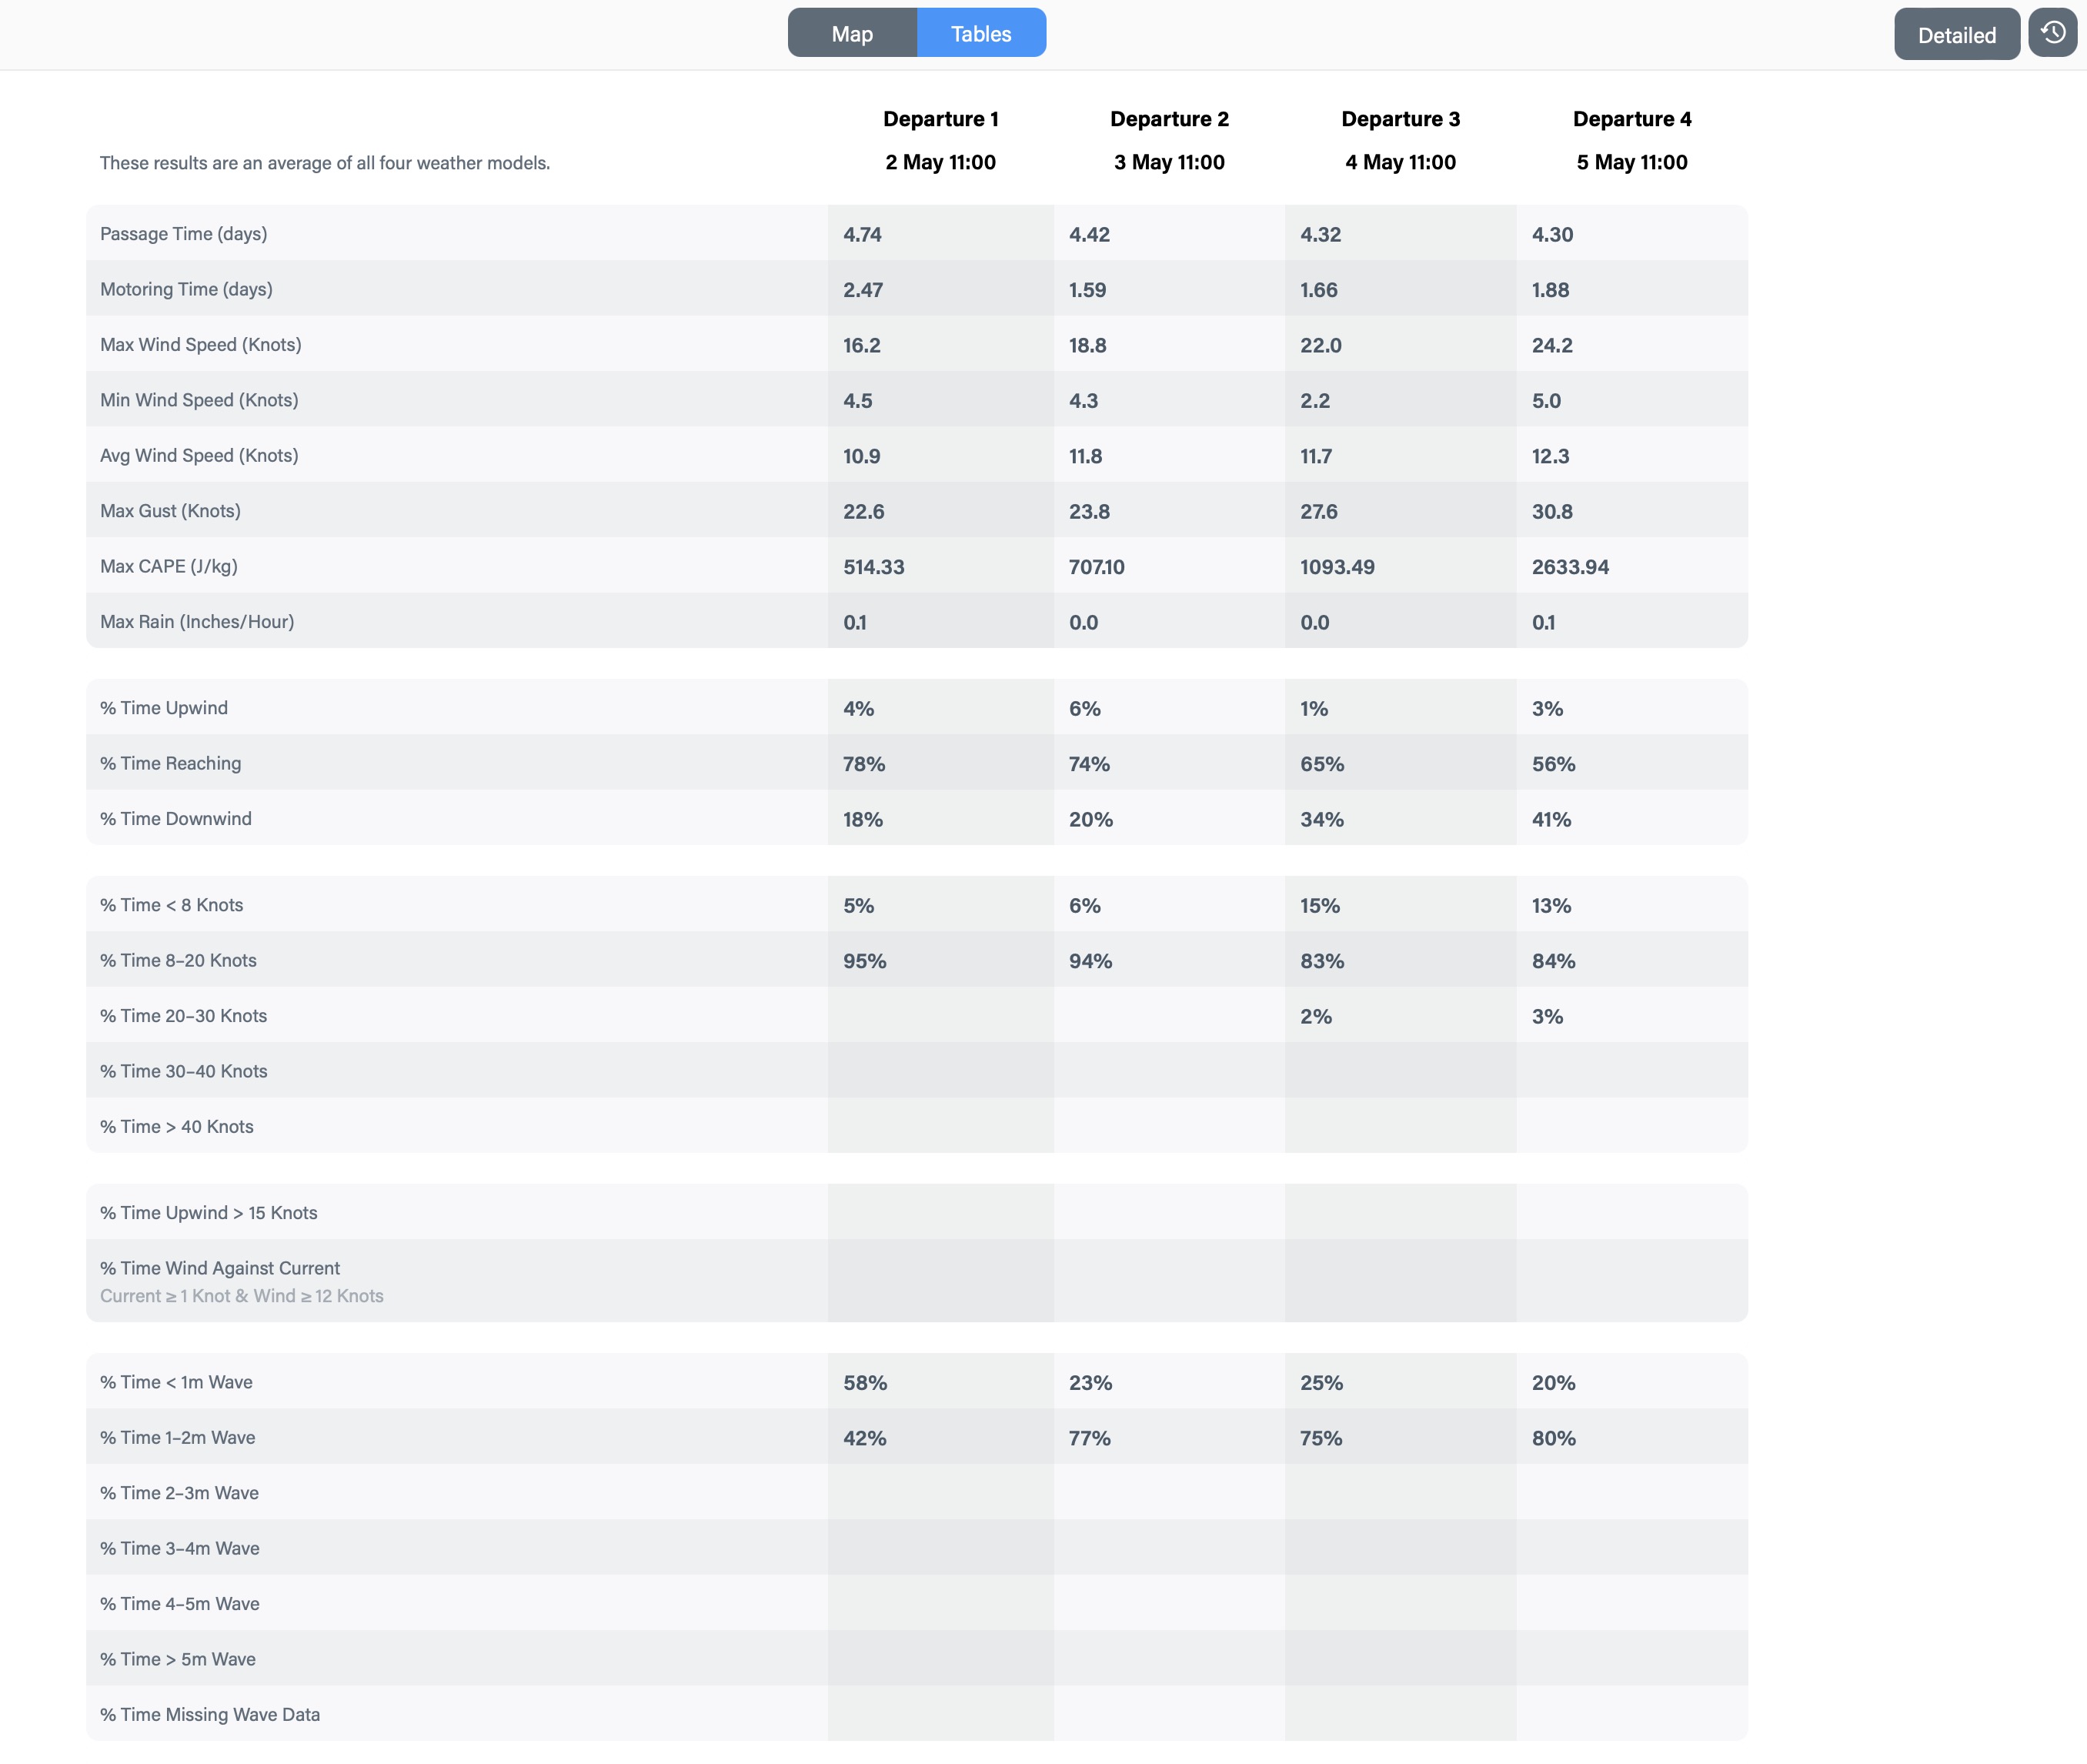
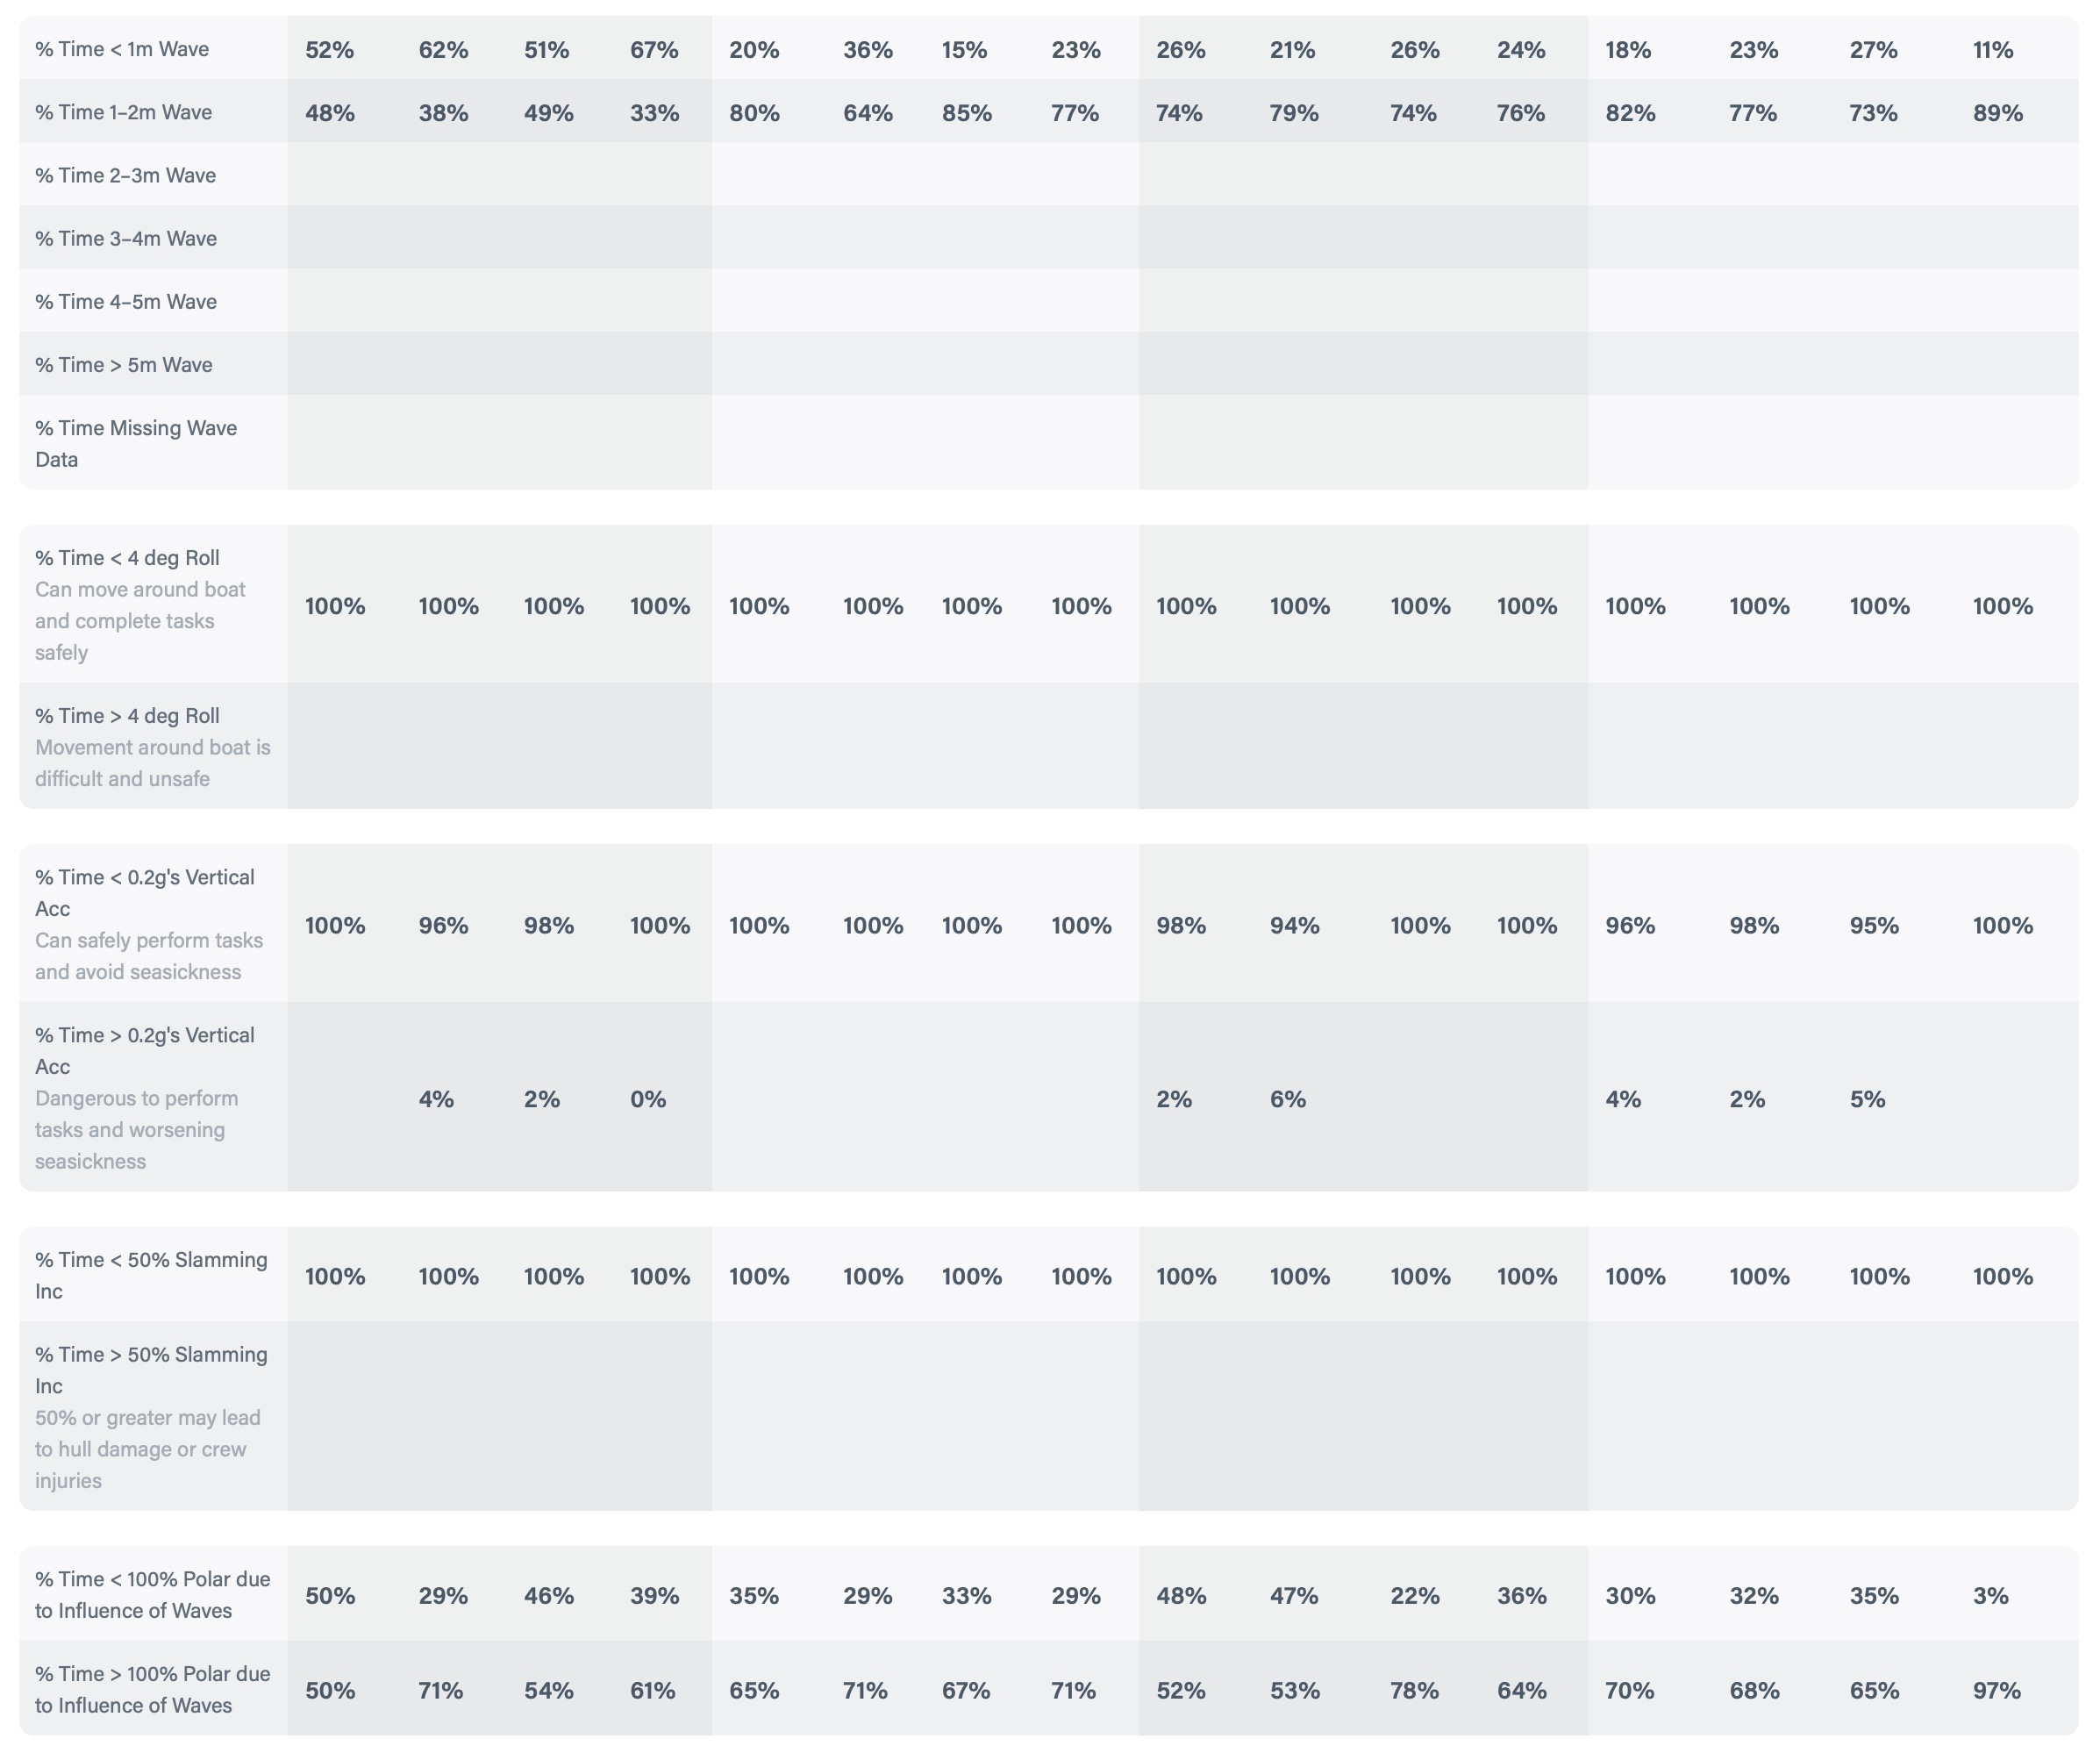
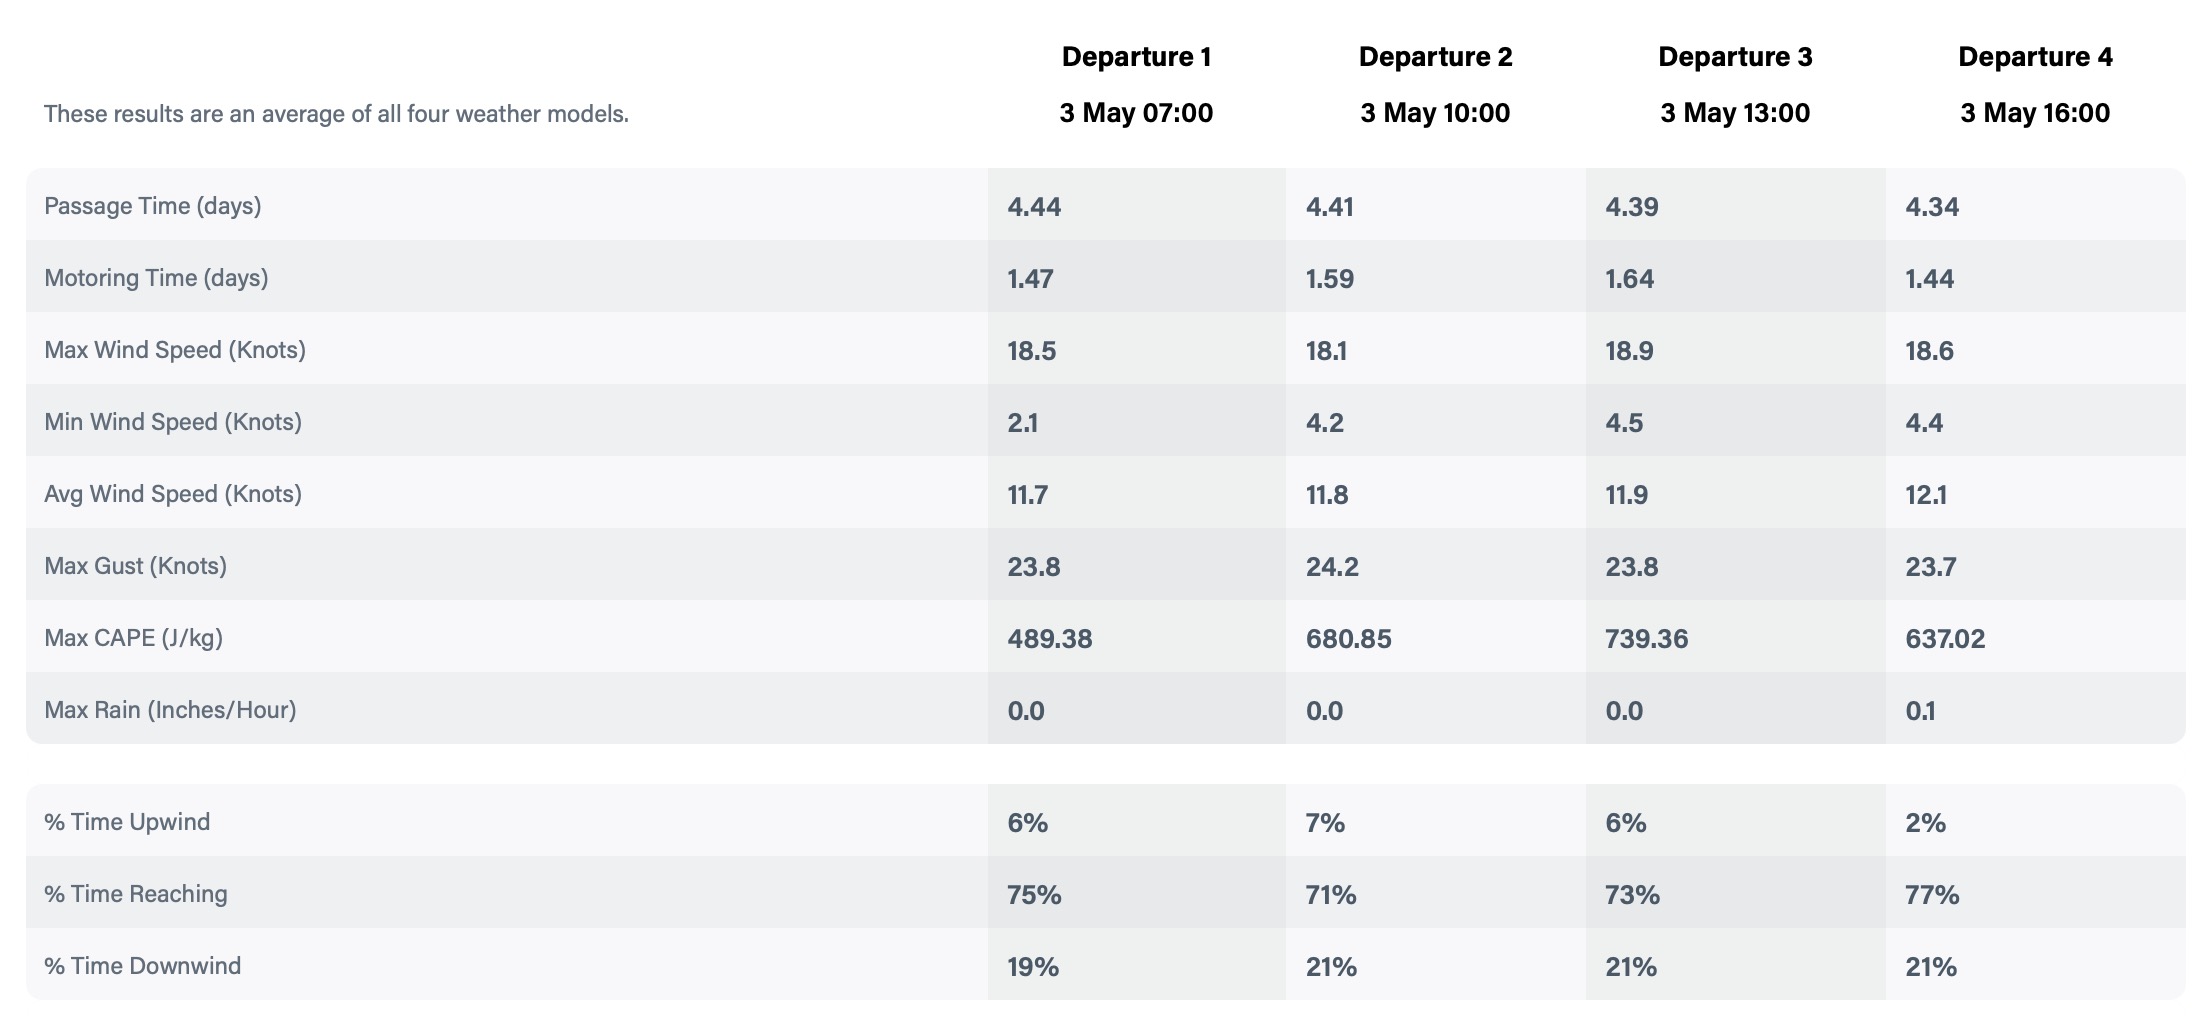
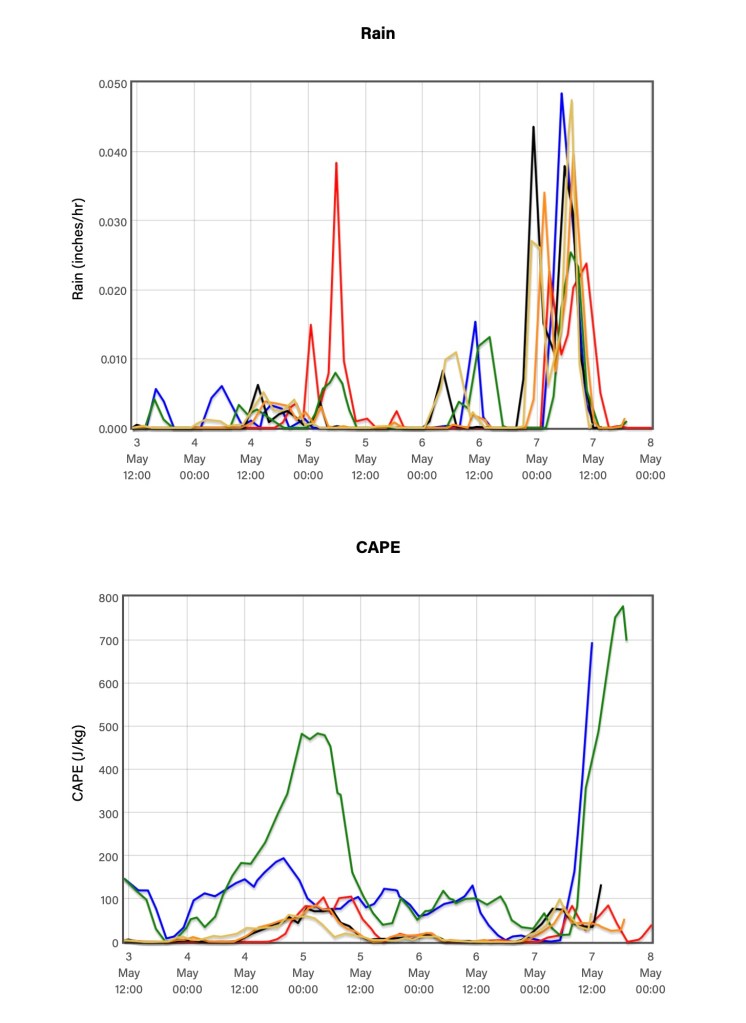
Looking at my output from Departure Planning for the Abacos to the Chesapeake Bay, Departure 2 is a good day to leave. Iโ€™m making this conclusion based on several factors. The Motoring Time is only 1.5 days (on average). About 94% of the time, the wind will be greater than 8 knots. The CAPE (Convective Available Potential Energy) value measures the energy available for convection, indicating the potential severity of thunderstorms. The CAPE value is a bit high per the GFS model, which is typically pretty good at predicting thunderstorms. You usually need a high CAPE value (over 1,000) with rain to have thunderstorms. I would keep my eye on this one since itโ€™s getting close.

Depart Data Details – Top of Screen

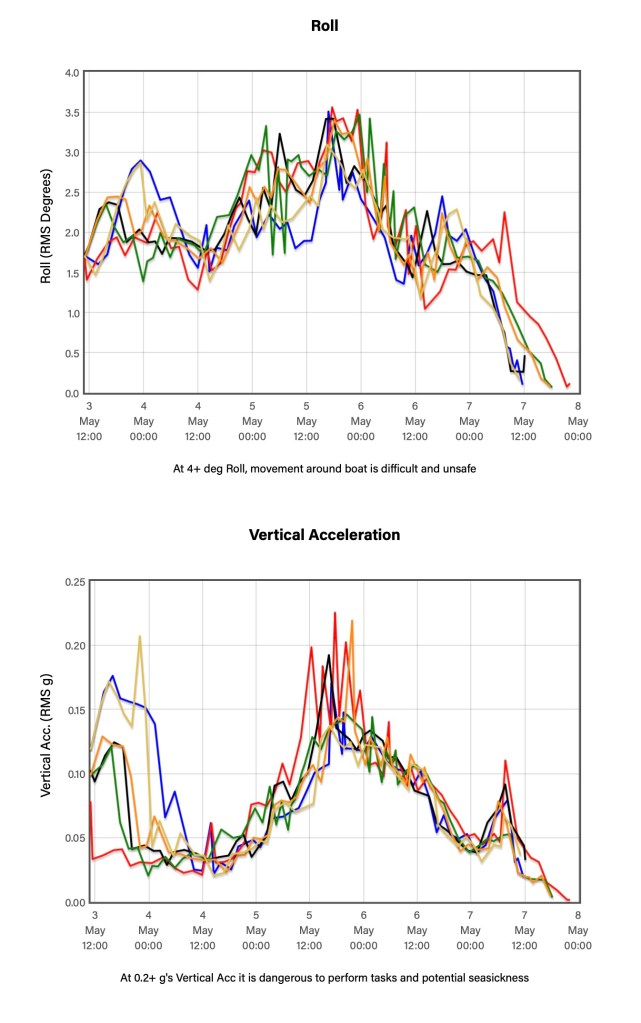
The waves will be less than 2 meters, which is very important to us, but more important is the effect of the sea state on the boat. Thatโ€™s where the four lower sections in the screenshot come into play. This is where PredictWind excels, in my opinion. The amount of roll will be less than 4ยฐ for the entire passage. This is important for us because anything over that is where Anna gets seasick. Vertical Acceleration is caused by the boat bashing into waves, which is usually over 0.2gโ€™s when sailing upwind in rough seas. The final section has a lot packed into one number: the sea state’s impact on the boatโ€™s performance. Less than 100% of boat polar means the seas are rough enough to slow the boat. Overall, Departure 2 looks reasonable.

Depart Data Details – Bottom of Screen

Once I narrow down the day I want to leave, I rerun the Departure Planning to see if there is a preferred time to go. In this case, weโ€™re sailing such a long distance that our departure time doesnโ€™t matter much. But if it was a shorter journey, I may have better weather if I leave in the afternoon versus the morning. Of course, with shorter sailing distances, we also have to consider our arrival time, so we may not pick the most optimal departure time because it would cause us to arrive in the middle of the night (something we avoid).

Departure Data 3 hours Apart

Weather Routing

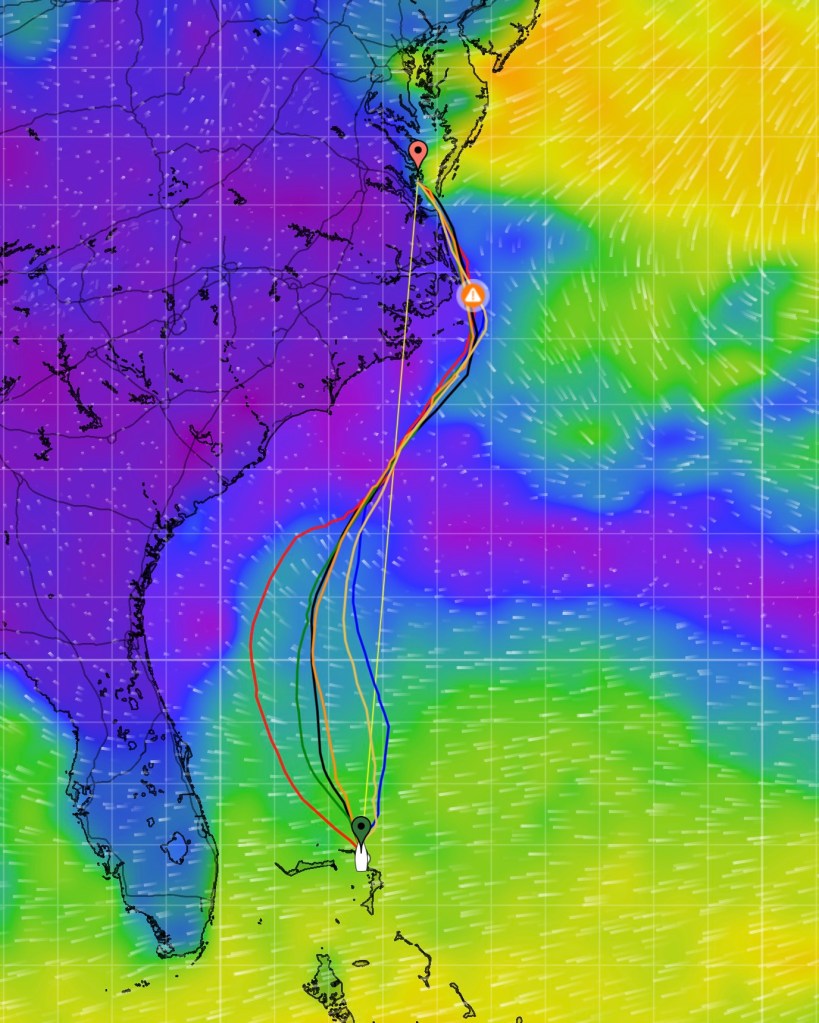
Now that I have my departure date, Iโ€™ll switch to the Weather Routing feature in PredictWind. In this case, I chose to leave at 1100 to time our departure with slack tide at the Nunjack Channel, the point where we plan to exit the Abacos into the Atlantic Ocean. The following image shows the suggested routes based on each modelโ€™s prediction of the weather (using my boatโ€™s polar as explained above). All six models suggest we head northwest and follow the wind as it veers around.

Each Model’s Recommended Route

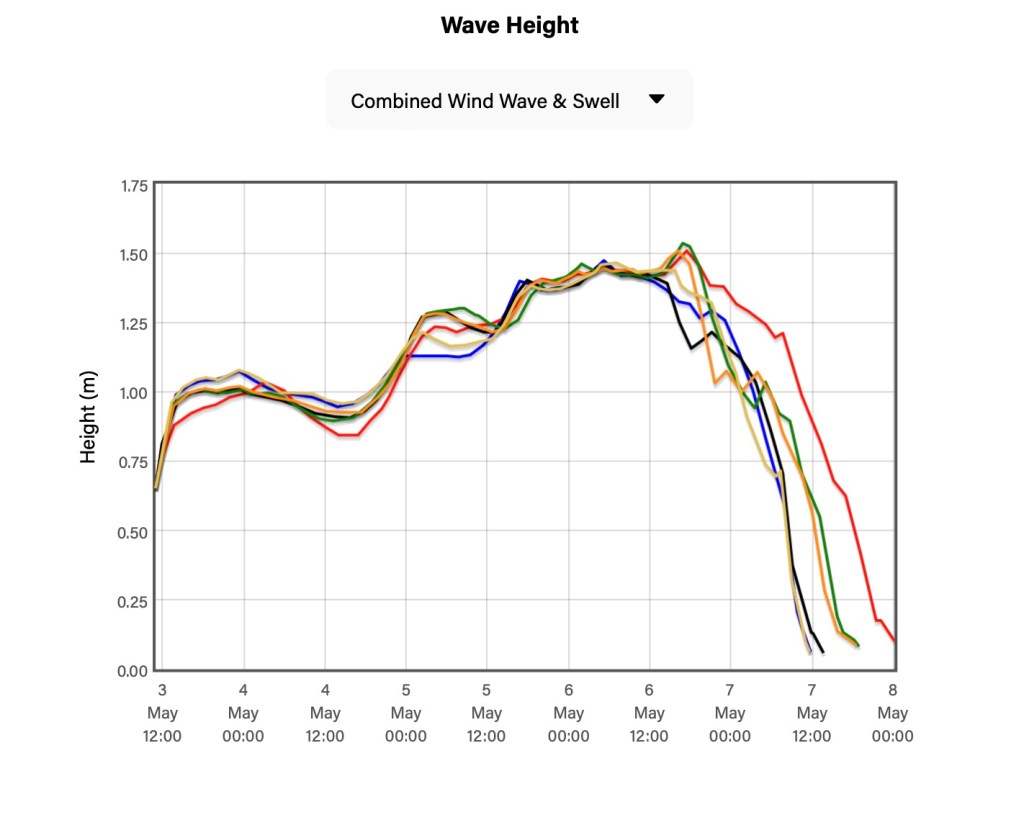
The combined wave and swell look good to us. Since weโ€™re sailing offshore, I would consider this sea state fine.

Wind Wave and Swell Over the Route

The Roll and Vertical Acceleration are approaching the uncomfortable zone, but when I reconciled this with the route, it was apparent this is caused by the Gulf Stream. We expect the ride to be rough getting into and out of the Gulf Stream. We also downloaded the forecast for ocean currents and tracked our location relative to the forecasted location of the Gulf Stream. The PredictWind routing model considers the effects of currents on your route. If there is a benefit to sailing into a favorable current, it will route you in that direction.

Sea State Over the Route

I mentioned before that the high CAPE value caught my eye. We might have some thunderstorm activity on May 5th and 7th. We need to continue monitoring this, especially in lighter air, where we donโ€™t want to get caught with our spinnaker or Code 0 up in a squall. You cannot do much to avoid lightning, but we try.

Thunderstorm Potential Over the Route

Once we are on our way, I will download the weather twice daily using the PredictWind Offshore app. This version of the app saves all the data offline, which is handy for analysts after the passage and for safety in case we lose communications while en route. Since the weather is constantly changing, so will your route, so itโ€™s essential to rerun the weather router based on your current position. I typically calculate a new route in the morning and the evening before sunset, which coincides with when all six models PredictWind offers are updated. It also allows us to discuss our strategy for night sailing before we start our sleep rotation.

The Passage to the Chesapeake

Since I took these screenshots before we completed the passage, you may be curious how it matched reality. We departed Green Turtle Cay at our planned time of 1100, getting through Nunjack Channel around 1200. Once out of the channel, the wind was light(ish), around 10 knots, so we decided to sail with the Code 0, which put us on a route similar to the red line. As the wind speed picked up and veered around, we furled in the Code 0 and pointed higher with the genoa, heading towards our rhumb line. By the middle of the next day, we had to turn on one engine and motor-sail for part of the day. By the end of that day, we had the engine off and were sailing again. The sea state during this time was on the beam, but not uncomfortable. Sunday (day three) we encounter squalls with a few thunderstorms. None of the squalls hit us, but flashes of lightning in the distance certainly kept us worried. The thunderstorms were to our west, along the coast of Georgia, and only made their way east after we had sailed past. Approaching the Gulf Stream, the seas were rough. It was rougher than both the data and I had anticipated. However, once we were firmly in the Gulf Stream, the seas flattened out, and the 2 to 3 knots of current put a smile on our faces. It wasnโ€™t until the fourth day, May 7th, when we were past Cape Hatteras, sailing along the Virginia coast, that we experienced the second round of thunderstorms. This time, the rain and lightning were offshore, to our east, and once again, didnโ€™t impact us other than make us worry.

The PredictWind forecasted route and sea state were about 90% accurate in my estimation. The rough sea state approaching the Gulf Stream was worse than they predicted, but not a surprise. The two times we encountered thunderstorms were in the data, but only the GFS accurately predicted it. Our conservative boat polar predicted us to arrive Tuesday night, but we dropped the anchor Tuesday afternoon. This was expected since we sailed faster. We also motored around 20 hours, less than the 38 hours they predicted. Faster sailing and less motoring are shortcomings caused by the boat polar used by the PredictWind models, and we are aware of this and will consider this on any passage. The wind speed and direction were pretty close to what was forecasted.

Conclusion

In summary, successful passage planning requires a combination of reliable tools, practical experience, and continuous learning. PredictWind has proven invaluable in optimizing our routes and ensuring safer, more efficient passages. However, it is essential to recognize that no tool is perfect. The key to maximizing the benefits of PredictWind lies in understanding its capabilities and limitations, accurately configuring your boat’s polar data, and interpreting the forecast data with a critical eye.

By regularly reviewing past voyages and adjusting our strategies based on what we learn, we continue to refine our approach and improve our passage planning skills. Remember, while technology can significantly aid in planning, the skipperโ€™s judgment and experience are irreplaceable. With a thoughtful, informed approach, you can make the most of the resources available and enhance the safety and enjoyment of your sailing adventures.

Uncategorized

Electricity Production & Consumption on Coronado

Since Coronado is our floating home, we do not have access to unlimited electricity and water like our friends on land. The following is a summery of how we make and use electricity on Coronado.

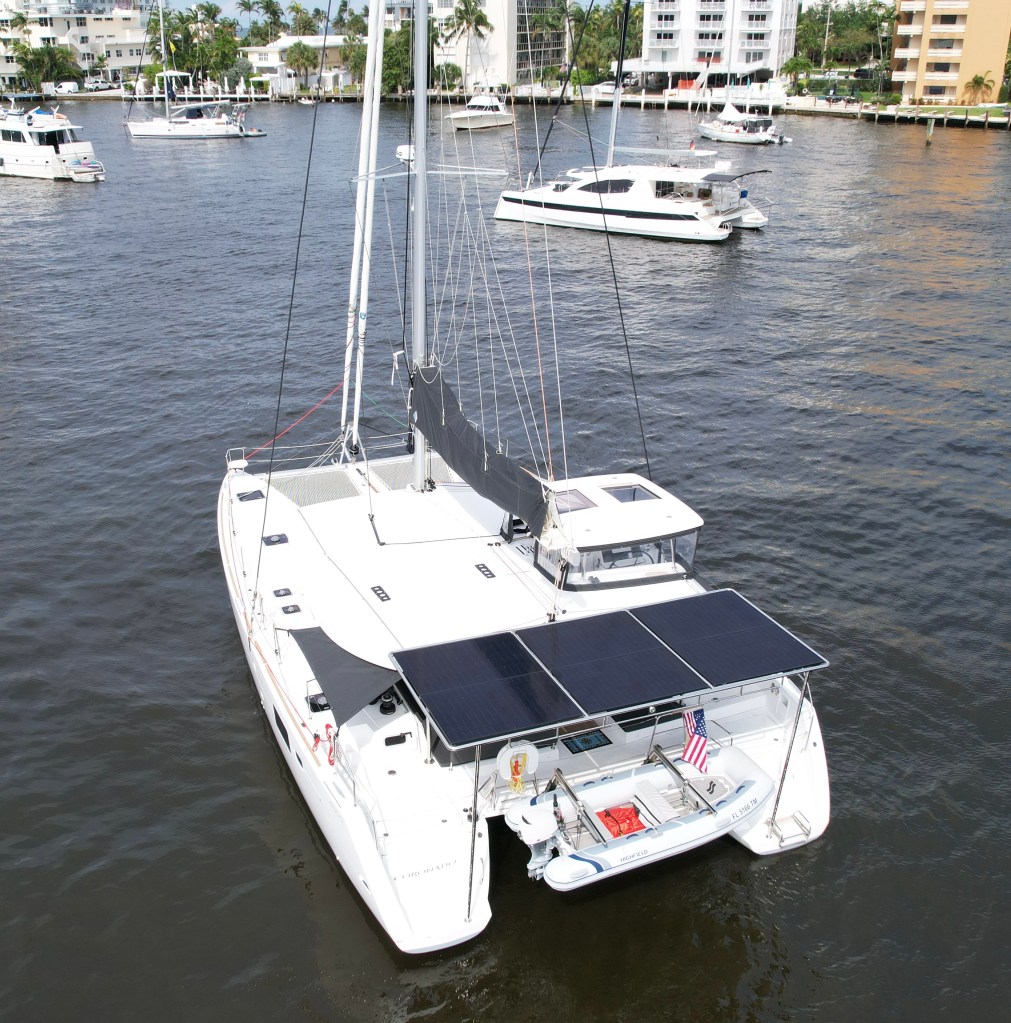
Coronado’s six-panel solar arch.

Solar

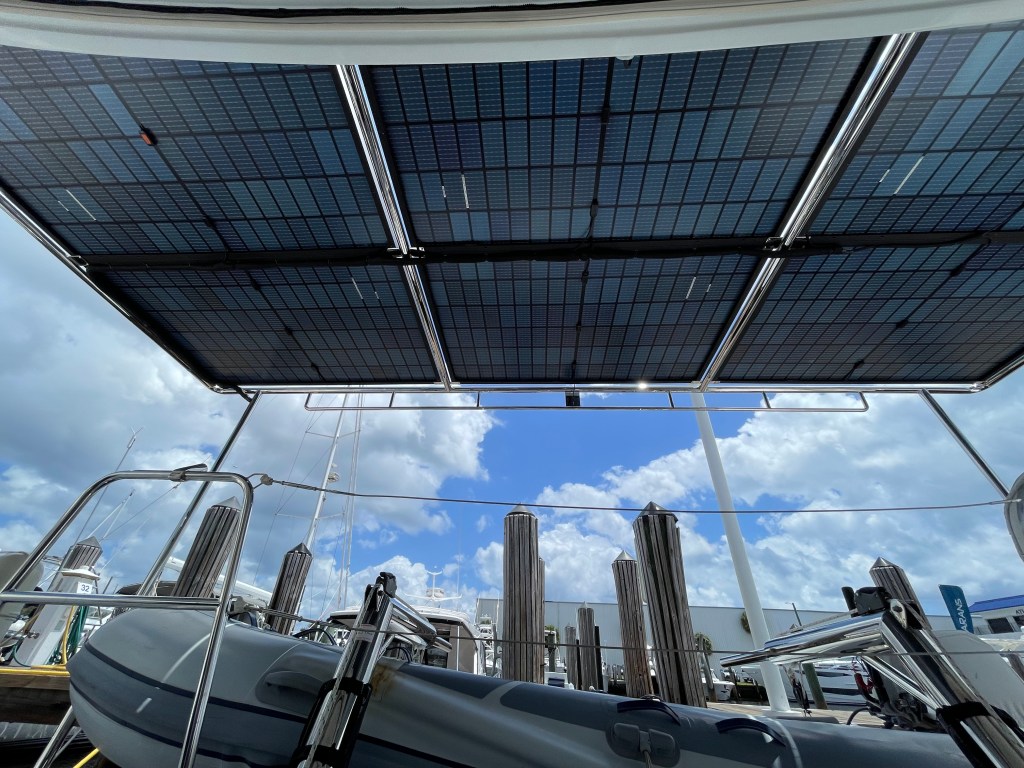
For electricity, we primarily generate our power from the sun via our 2,400-watt solar array. All our solar panels are mounted on an arch off the back of the boat. This puts the panels in an area of the boat where they are least likely to be shaded by the mast or sails. When at anchor, we typically pull the boom to one side to help ensure there are few shadows on the panels. On the solar arch, we have mounted six 400-watt panels. Our panels are bifacial, which means they have solar cells on both sides of the panel. Since the panels reside above the water, they can capture the reflection of the sun off of the water. We see the best benefit of this in the morning and evening when the sun is low and the glare off of the water is high. This allows us to generate solar power for a longer period during the day. 

Solar cells on the bottom of our bifacial panels

The solar panels are wired to three solar controls (two panels per controller), which regulate the power produced versus consumed. If the batteries are fully charged and we are not using any power, the controllers will turn the power off. However, if the batteries are fully charged and we continue to need power, the controllers will divert the power where itโ€™s needed. This is one reason we save high power-consuming activities, like running the washing machine, dishwasher, or watermaker, for the day. We are basically washing our clothes with power directly from the sun!

Generator

We have a 13,000 Watt diesel generator when there isn’t enough sun to keep pace with our power demands, like when it’s been raining for several days and we are stuck on the boat. We also use the generator to power our dive compressor and air conditioning. Our battery bank could power both of these, but they use a lot of power over a long period of time. We primarily use our air conditioning only when weโ€™re in marinas โ€“ at anchor, the boat points into the wind, so we usually have a nice breeze with the hatches open. When we purchased Coronado, we had the option of two generators, one that was too big for our needs or one that was too small. We opted to go โ€œtoo bigโ€. The upside to the larger generator is that we can literally turn on everything electrical in the boat, and the generator could handle it. The downside is the additional weight of the larger generator.

Engine Alternators

When Coronado is motoring, we also get power from our two 125 amp alternators on our diesel engines. This gives us a third option for generating power. The more redundancy you have, the more self-reliant you can be.

Shore Power

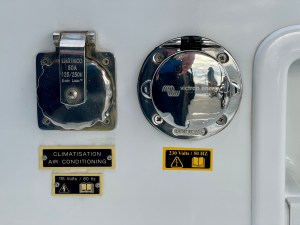
Occasionally, we are in marinas and can plug directly into shore power. Since we travel the world, and electricity standards vary from country to country, I have configured Coronado to accept 120 and 230-volt power sources. Rather than use adapters for each region, I installed an EU-style plug for 230 V and kept our US-style plug for 120 V shore power. This makes it very clear which type of power is being used.

Since Coronado is a 120 V (US spec) boat, plugging into shore power in the US means all the electricity on the boat is coming from the local power grid. I plan to enable an option allowing our solar to provide power and only augment power from shore when needed, but I havenโ€™t implemented it yet. Coronado consumes shore power a little differently when weโ€™re in parts of the world with a 230 V power grid. On 230 V, power is used only for charging our batteries and running the air conditioning. Since weโ€™re a 120 V boat, we donโ€™t want power going straight to the outlets in the boat. 

There is also a frequency difference between the 120 V US power, which runs at 60 Hz, and most of the 230 V world, which runs at 50 Hz. We can easily step down the voltage from 230 V to 120 V, but changing the frequency is more complex. We have many items on Coronado that will not run at 50 Hz, our oven and cooktop being the most critical. So, to get around the frequency mess, we just run everything off the batteries, like we would at anchor, and use a battery charger that supports 230V/50Hz power to replenish the power we drain from the batteries. As mentioned, the air conditioning only runs off the generator or shore power. When plugged into 230 V shore power, we have a transformer that steps down the voltage to the air conditioner. But what about that frequency problem I mentioned? Luckily, the air conditioners are one the items on Coronado that will run at either 50 Hz or 60 Hz.

Batteries

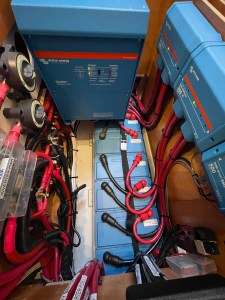
So far, Iโ€™ve written about how we generate power. Now, Iโ€™ll talk about how we store power. At home, you donโ€™t need to store power. You take what you need from the power grid. On Coronado, we need to store the power we generate during the day so we can turn on our lights at night. We store the power we generate in a 1,600 Ah lithium battery bank (Lithium-Iron-Phosphate (LiFePO4) to be exact). The reasons we use lithium batteries are many, but one of the biggest reasons is that lithium batteries can absorb a lot of energy in a short period of time compared to the lead acid-type batteries you use in something like your car. This makes lithium batteries a great companion with solar power. Our solar array puts out a lot of power during the peak of the day. If we used lead-acid batteries, we would not be able to capture nearly as much of the sunโ€™s energy. Even with our generator, it can run for a significantly shorter period of time before the batteries are fully charged. 

Another big advantage of lithium batteries is their usable capacity. In practice, you should only discharge a lead acid battery to about 50% of the capacity; going lower regularly will damage the batteries. (Have you ever run down a car battery and noticed a month later it needed to be replaced?) Lithium batteries do not have this limitation. You can drain a lithium battery to near zero and itโ€™s fine. Iโ€™m sure many of you have done this with your phone! All said, that means a 1,600 Ah lead acid battery bank is only 800 Ah of usable capacity. Itโ€™s not uncommon on Coronado for our lithium battery bank to get down to 30% after a couple of days of clouds and rain, only to have the sun come out again and fully recharge our battery bank by 2:00 PM.

Inverter

Finally, Iโ€™ll touch a bit on using power. On Coronado, we have a 5,000 W inverter/charger. The inverter/charger’s role on board is to turn AC electricity into DC electricity and vice versa. If you donโ€™t know the difference between the two, AC typically comes out of the socket in the wall and DC typically comes from a battery. On Coronado, we have power stored in batteries (DC) but need AC power for the outlets and to run appliances. On the other hand, we get power from the generator and shore power, which comes into the boat as AC power, but we need to store it in our batteries as DC power. With a 5,000 W inverter, we can produce a lot of AC power. This is how we can run large household appliances like our electric oven, induction cooktop, washing machine, dishwasher, and water heater from our batteries.

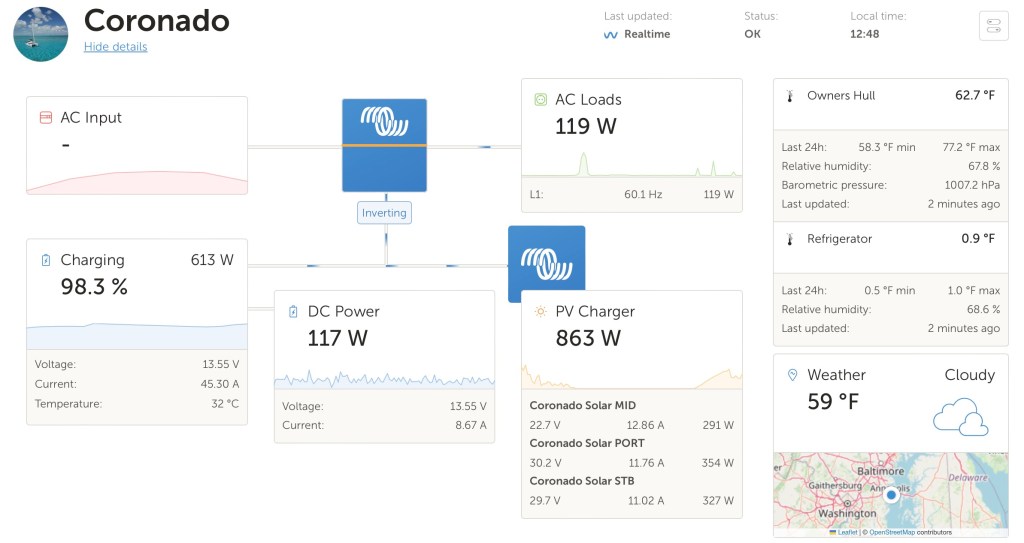
If you want to see how this all comes together, check out our Victron Remote Monitoring portal. Here, you will get a real-time view of the power produced and consumed on Coronado.

https://vrm.victronenergy.com/installation/294319/share/4c5df64b